How Are You Measuring Your AI ROI?
A Case Study for Mortgage Investors
If the answer is developer hours saved, I think we’re measuring the easy part — and missing the bigger prize.
The problem isn’t information. It’s acting on it.
The information an investor needs mostly exists already. It just arrives scattered — emails, dealer commentary, internal reporting, a dozen data feeds. Tracking all the sources is hard enough. Deriving insight and acting on it in time? Nearly impossible at human speed.
The first-order ROI is real — and one-time
Yes, AI automates the collection. Yes, AI coding tools can stand up the dashboard that aggregates everything, with drill-downs. That’s real ROI, and worth capturing. But it’s one-time ROI: the savings recur, but the capability doesn’t compound. Your highest-value people are still going through the motions: clicking, drilling, hunting for the missing piece, deciding what to look at next.
The durable ROI is different
It comes from making the high-value portfolio manager (PM) and the uber-analyst more powerful. Not summaries — actions: sharper pricing, less leakage through better risk management, new sources of return spotted as market conditions evolve.
The tech world calls the machinery “loops enhanced by graph engineering.” Strip the jargon and it’s simple: workflows that manage dependencies and put human validation gates at the decision points. Software developers have been working this way for months — sometimes without naming it. The processes translate to investing better than you’d expect.
Two properties do most of the work.
First: the graph
The workflow maps which tasks actually depend on which. Everything independent runs in parallel — that’s speed. Results synchronize before a decision is staged — that’s fewer half-formed questions thrown back at you. The PM gets one decision point with the evidence assembled, not twenty interruptions.
Second — and this is the part I find most interesting: unknown unknowns
Newer models can reason much longer and more carefully than the last generation, and one consequence is underappreciated: they are effective at surfacing gaps in your own framing. There is a specific class of unknown unknowns — things well-represented in the model’s knowledge but outside yours — that a model can convert into explicit questions. You’re watching delinquencies by geography; it asks whether insurance-premium shocks in those same markets belong on the dashboard. You benchmark refi incentive to a survey average; it asks what lenders are actually offering that borrower today.
That’s a genuine and valuable capability. Here’s the trap: believing that a “what am I missing?” pass gives you coverage. It doesn’t. Run it ad hoc and you get a different, unaudited coverage claim every time.
So we use the capability where it belongs — at design time. When we build a loop, human and AI iterate on what the loop should watch, and the blind spot questions get argued out once, deliberately, by people who know the portfolio. Then the answers are committed to a deterministic pipeline: the same checks, every run, written down. Coverage becomes explicit and auditable — not an assumption remade on every prompt. And when something does slip through, it doesn’t just get fixed; it becomes a permanent regression test the system must pass forever.
Coverage compounds. That’s the difference between a workflow and a chat window.
What this looks like in practice
We started with non-QM (non-qualified mortgage) investors. The loops we’re building:
- Pricing — wholesale rate sheets parsed daily; every program and pricing change diffed against the market
- Market intelligence — new deals scored rich or cheap — over- or underpriced — vs comparables the day they price; street commentary attributed to its source and date, never blended into an unattributed consensus
- Asset allocation — where return is migrating as conditions evolve: primary vs secondary market, cohort vs cohort
- Risk & outliers — roll rates (how delinquencies migrate from 30 to 60 to 90 days late), concentrations, and the checks that separate borrower credit deterioration from a soft local housing market
- News & regulatory scanners — policy, litigation, counterparty watch, with two independent sources behind any credit-negative claim
- Macro — the weekly backdrop every other loop cites, so context is shared instead of re-derived
Case study: a mortgage investor’s morning in the pricing loop
Here’s one of those loops in the wild — a demonstration run on live market data from this August.
A non-QM investor’s earliest view of the primary market lives in wholesale rate sheets: nine lenders in this build, each publishing rate grids and adjustment matrices in its own format, on its own schedule. Read together, they’re a running record of who wants what risk at what price. Almost nobody reads them together. The realistic before-state isn’t a team parsing nine sheets every morning — it’s an analyst spot-checking two or three when a deal is in play, and everything else surfacing weeks later, if at all.
The loop runs before the market day starts. It fetches and parses every sheet, then works as a graph: nine lenders in parallel, every price cell and every adjustment diffed against that lender’s own history, results synchronizing only where the analysis genuinely needs all nine — cross-lender dispersion, and the comparison against where benchmarks moved. All arithmetic runs in SQL against the loaded data, never inside the model, and every number keeps a link back to the exact source file it came from. That morning: 20,000+ data points scanned.
What reached the PM was not 20,000 data points. The gates — freshness checks, numeric reconciliation, materiality thresholds, an independent model challenging the findings — cut it to six candidate findings, of which five survived the challenge — two material signals and three escalations — staged as a single review that took about fifteen minutes. The diagram below shows that morning end to end.
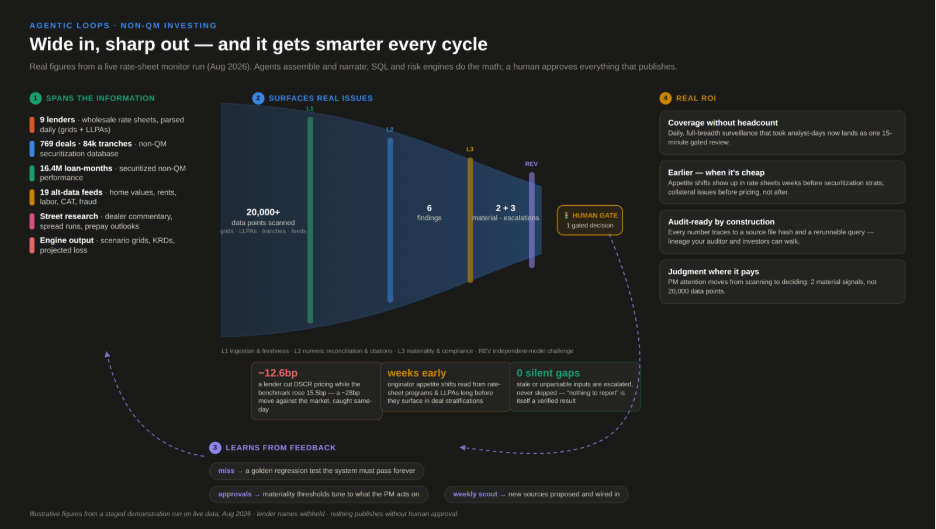
The material catch: one lender had cut pricing on DSCR loans (investor-property loans underwritten on rental cash flow) by 12.6 basis points (hundredths of a percent) the same morning benchmark mortgage rates moved 15.5bp the other way — roughly a 28bp swing against the market, caught same-day. That’s valuable twice. Tactically, it’s better information for anyone pricing or bidding that collateral this week. Strategically, it’s an appetite signal: an originator reaching for volume shows up in its rate sheet weeks before it shows up in the collateral of the deals you’ll be offered. Wait for the deal stratifications — the collateral tables published when a deal comes to market — and you’re reading old news.
The three escalations matter just as much. Three of the nine sources came in stale or unparsable that morning, and the loop escalated them instead of skipping them — so “nothing new from the other six” is a verified statement, not an assumption. That’s the unglamorous half of the ROI: gates are what keep silent gaps from quietly turning your coverage claim into fiction.
The ledger for that single morning: full-breadth coverage that used to cost analyst-days, delivered as a fifteen-minute gated review. A signal in hand weeks earlier than the alternative. An audit trail your risk committee — or your investors — can walk from any number back to a source file and a rerunnable query. And the PM’s judgment spent on two decisions, not twenty thousand data points.
The loop part matters most: every approval or correction at the gate tunes what the system treats as material, and every miss becomes a new golden test. It gets smarter every cycle.
So how do we measure the ROI?
- Headcount the PM would have needed — sure, but that one’s overdone
- Basis points of better pricing across the book — what would 1bp be worth in yours?
- The wrong decision you didn’t make — the fraud flag or the stale input caught before anything was priced off it
- And the verification gates themselves. Unchecked AI doesn’t produce zero ROI; it can produce negative ROI. The gates are what keep the sign positive.
How are you measuring yours? What’s the decision in your process that arrives too late today?
If you’re building toward something similar — or stuck in dashboard land — please message me. Happy to compare notes.