Models & Markets Update: August 2026
Register here for next month’s call: Thursday, September 17th 2026, 1 p.m. ET.
Key Takeaways
- Prepayment models continue to track realized speeds well, even as July speeds fell across the board: roughly 4% for FN/FH coupons 5.5 and below, 3.8–4.7% for FN/FH 6 and higher, and 1.7% (≤5.5) and 7.5% (6+) for Ginnie
- A deeper look at the conventional universe shows where the v3.7 model is straining: it ran 1.7 CPR fast on FH30 in July (10.0 modeled vs. 8.3 actual), missed month-over-month direction for out-of-the-money cohorts, and shows S-curves that are too flat for unseasoned loans and too steep for seasoned ones
- Federal debt has reached $40 trillion (about 125% of GDP, with a deficit near 6% of GDP), while consumer stress is concentrated in credit cards (~13% of balances 90+ days delinquent), autos (approaching 6%), and borrowers aged 70+
- The 30-year Treasury touched 5.30%, its highest level in roughly 20 years; the Fed funds rate (350–375 bps) is expected to hold at the next two meetings, with a meaningful chance of an increase and no cuts expected through 2027
- Consensus forecasts put the 10-year Treasury above 5% in 2027 and 30-year mortgage rates above 7% around the turn of the year; with core inflation near 2.5%, a weakening labor market, and tight inventory, home prices look more likely to stagnate than fall significantly
This month’s call covered prepayment model back-testing, a conventional deep dive on model performance and CBR/CCR trends, federal and consumer debt, and the latest macro and housing picture. Yashwant and Anish Roy of RiskSpan’s quantitative modeling team and Divas Sanwal presented.
You can read the recap below or click here for the entire recording.
Prepayment Model Back-Testing
Modeled CPRs continue to track observed speeds closely, though speeds declined across all cohorts with the August factor data update. Fannie/Freddie coupons 5.5 and below fell approximately 4%. For coupons 6 and higher, Fannie speeds fell 4.7% and Freddie 3.8%. Ginnie Mae coupons 5.5 and below fell approximately 1.7%, while Ginnie 6 and higher fell approximately 7.5%.
The team attributes the slowdown in premium coupons (6 and higher) primarily to a 7 bp rise in the driving mortgage rate, partially offset by a 5% increase in day count. For coupons 5.5 and below, the decline reflects an 8% month-over-month drop in seasonal housing turnover. The full interactive back-testing reports are available in the RiskSpan platform.
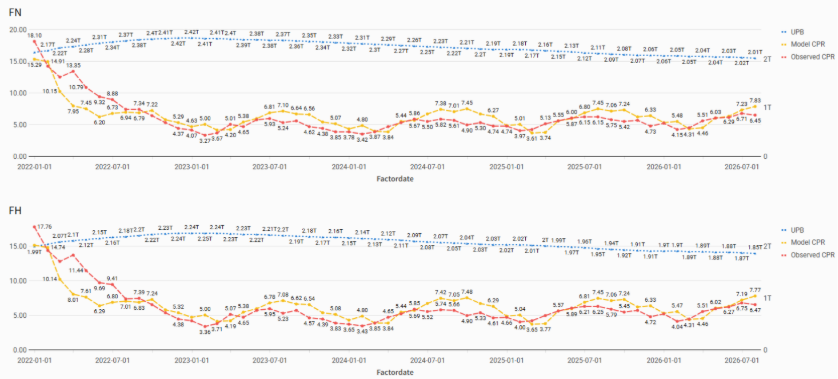
FN/FH WAC 5.5 and Below — Modeled vs. Observed CPR
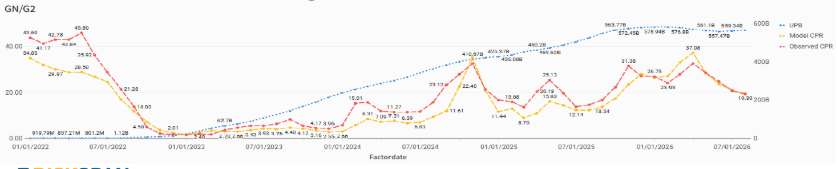
GN/G2 WAC 6 and Higher — Modeled vs. Observed CPR
Conventional Deep Dive: Model Performance and CBR/CCR Trends
As in prior months, the quantitative modeling team took a closer look at the conventional universe using model v3.7. This research also supports the next-generation prepayment model initiative by providing a more granular view of prepayment behavior and highlighting opportunities for future enhancements.
FH30 Aggregate and Coupon-Level Speeds
FH30 printed 8.3 CPR in July 2026 versus a model prediction of 10.0 CPR, a fast bias of 1.7 CPR. Month over month, actual speeds fell 4% while model speeds rose 4%. Following client feedback, the team added 3-, 6-, and 12-month error ratios this month. At the aggregate level, the model carries a 12% fast bias over the trailing three months, versus only 2% over six and twelve months. Over the trailing 12 months, coupons 1.5%–5.5% have been persistently about 10% faster than actuals, while coupons 6.0%–7.0% have been persistently about 10% slower.
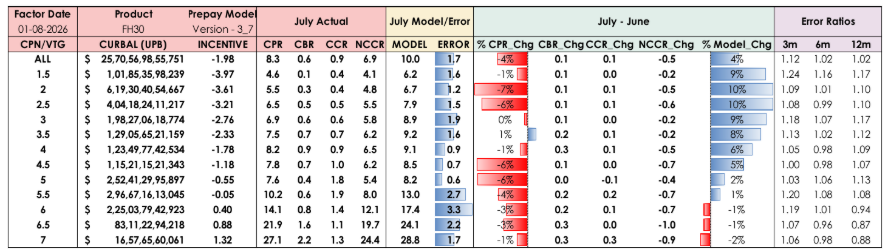
FH30 Aggregate and Coupon-Level Speeds — Actual vs. Model v3.7 (July 2026)
Missed Directionality for Out-of-the-Money Cohorts
The model missed month-over-month direction for out-of-the-money cohorts: model speeds rose about 7% while actuals fell about 3%. In-the-money cohorts behaved as expected, with model speeds down 1% and actuals down 2%. The team believes the miss is driven by the model’s seasonality component, which needs further calibration. Level errors are largest on the higher, in-the-money coupons, but month-over-month sensitivity is greater for out-of-the-money cohorts. Behind the aggregate 4% decline in actual speeds, the 7 bp rise in the 30-year driving rate and 8% drop in turnover seasonality were partly offset by a 5% increase in day count.
S-Curves by Loan Size and Seasoning
New this month, the team plotted S-curves of actuals against the model by loan size and moneyness, split into unseasoned (WALA 0–18, left) and seasoned (WALA 18–60, right) loans. The findings point in opposite directions:
- Unseasoned loans: the model S-curve is too flat. The in-the-money $400K+ cohort has a significant slow bias of about 12 CPR at a 7% coupon. Out-of-the-money cohorts converge within about 5 CPR, except the $0–200K cohort, which runs about 10 CPR slow. The model also does not capture the expected rise in speeds with loan size at a given incentive.
- Seasoned loans: the model S-curve is too steep. The in-the-money $400K+ cohort has a fast bias of about 7 CPR at a 7% coupon, and the $0–200K cohort is about 5 CPR fast. The model did not apply enough burnout decay.
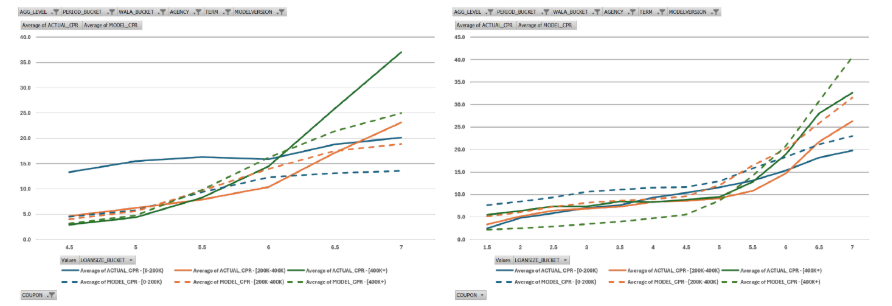
FH30 vs. Model (v3.7) S-Curve by Loan Size — Last 3 Months, WALA 0–18 (L) vs. 18–60 (R)
Buyout and Curtailment Across the Coupon Stack
Curtailment (CCR) follows a hump shape across coupons, peaking around 5.5%. This is primarily a seasoning effect: the 5.5% cohort has the lowest WALA, curtailment is front-loaded and peaks around a WALA of four, and the pattern is amplified by occupancy and purpose mix. Buyout (CBR), by contrast, rises sharply with coupon, especially at the high end. At a 7% coupon, CBR is roughly 3–5 times that of lower coupons, and the 7% coupon also has the lowest average FICO in the stack (725), consistent with higher-coupon loans being disproportionately associated with borrower credit stress.
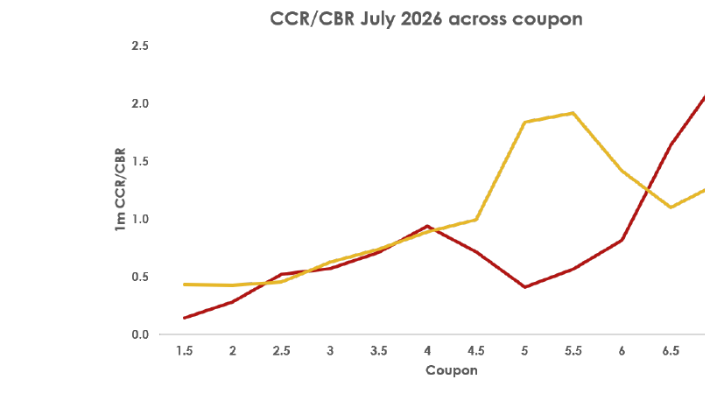
FH30 CBR and CCR Across Coupon (Actual), July 2026
Debt and Consumer Credit
The call opened this section with a new milestone: total U.S. national debt has reached $40 trillion. Roughly $50 trillion is expected within about five years, which RiskSpan’s reference thresholds treat as the point at which federal debt becomes unsustainable.
| Federal Metric | Current (Aug 2026) | Unsustainable Threshold |
| Total National Debt | $40 trillion | ~$50T by 2031 |
| Debt-to-GDP Ratio | 124.6% (June) | 140% (Penn Wharton) |
| Federal Budget Deficit | ~6% of GDP | 4–5% unsustainable |
| Deficit/Revenue Ratio | $1.33 spent per $1 revenue | $1.20+ unsustainable |
Federal Government Debt vs. Reference Thresholds
Federal interest costs are a growing concern. With the 30-year Treasury at 5.30%, new issuance replaces older, cheaper debt at higher rates, and debt service is already the government’s second-largest expense after Social Security. Unlike Social Security, it cannot be cut without risking the country’s credit rating.
Household debt stands at approximately $18.77 trillion, up about 2.1% year over year (and essentially flat versus $18.78 trillion in Q1, per the NY Fed’s August report). Mortgages make up about $13.6 trillion of that, leaving roughly $5 trillion of non-mortgage debt, with the fastest growth in auto loans and credit cards.
| Debt Category | Amount | % of Total | YoY Growth |
| Total Household Debt | $18.77T | 100% | ~2.1% |
| Mortgage Debt | $13.58T | 72.3% | ~2.0% (all-time high) |
| Auto Loans/Leases | $1.72T | 9.2% | 2.9% |
| Credit Cards | $1.26T | 6.7% | 3.9% |
| Student Loans | $1.87T | 9.9% | Slowed with payment pause |
| Other | $0.4T | 2.1% | Varies |
Household Debt Breakdown, Q2 2026
Where the Stress Is Showing
- Credit cards: There are approximately 650 million credit card accounts, roughly three per adult, and the count has grown rapidly over the last decade while other account types have been flat. Card balances of about $1.3 trillion sit against roughly $5.5 trillion in limits (about 20% utilization), and approximately 13% of balances are 90+ days delinquent, close to the financial-crisis peak. Much of this delinquent balance sits with smaller banks and fintechs rather than large banks, which have been careful about extending credit to lower-credit borrowers.
- Auto loans: 90+ day delinquency is approaching 6%, higher than at any point during the financial crisis. With the used-car market where it is, servicing and even repossession are often unprofitable, which is a concern for lenders as well as borrowers.
- HELOCs: Home equity revolving balances have grown meaningfully over the last four years, with about $0.5 trillion drawn against roughly $1 trillion in limits (about 50% utilization).
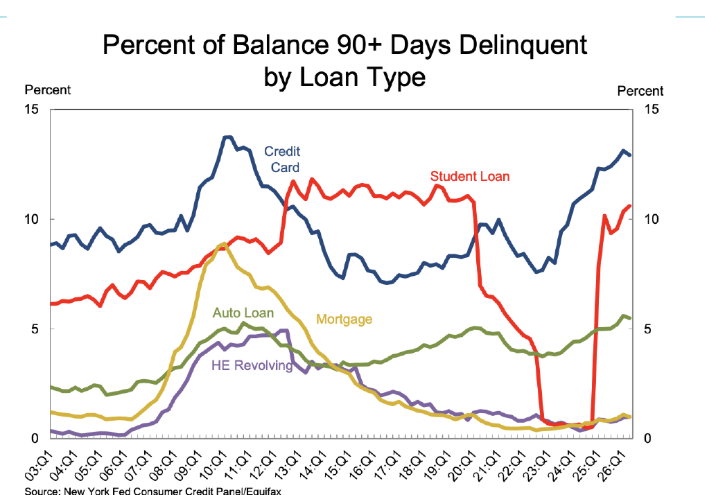
Percent of Balance 90+ Days Delinquent by Loan Type (NY Fed Consumer Credit Panel/Equifax)
One notable finding in the NY Fed data: younger borrowers have always shown the highest delinquency transition rates, but the 70+ age group now stands out for auto loans and credit cards, with rising transitions into serious delinquency. These borrowers are often on fixed incomes, so RiskSpan views this as an indirect signal of how inflation is eroding households’ ability to maintain their lifestyles.
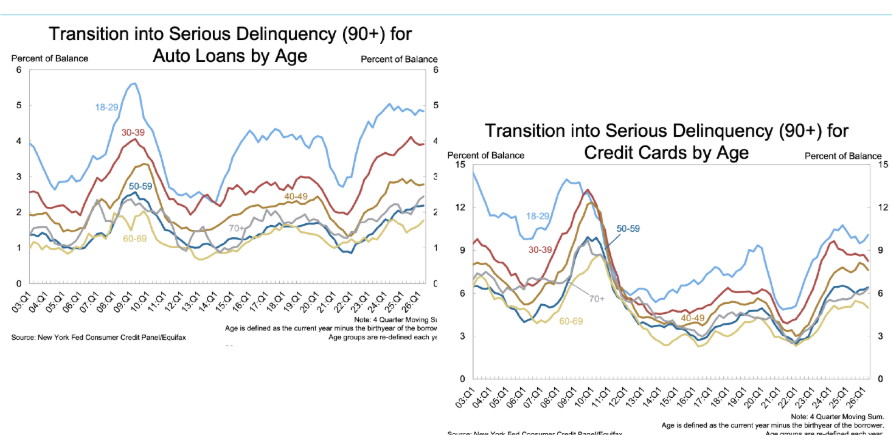
Transition into Serious Delinquency (90+) by Age — Auto Loans (L) and Credit Cards (R)
Where Averages Deceive
The average hides a sharp split in debt burden. The illustrative comparison below shows how much the mix of debt matters: a median household’s debt is dominated by low-rate mortgages, while the bottom quartile carries disproportionately high-rate revolving and subprime debt. Any economic shock could have an outsized impact on the credit market through that bottom segment.
| Median Household | Bottom Quartile | |
| Gross income | ~$80,000 | ~$40,000 |
| Disposable income | ~$65,000 | ~$35,000 |
| Debt | ~$35,000 | ~$15,000 |
| Debt mix | Low-rate mortgage (3.5–4%), card balance (~20%), auto loan (~8%), student loans | Subprime auto (~12%), credit cards (~24%), medical debt |
| Debt burden (% of disposable income) | ~30–35%: stretched but managing | 40–50%: severely strained |
Median Household vs. Bottom Quartile (Reference Figures)
Macroeconomic Update
Rates
The Fed made no change to the Fed funds rate in July and does not meet in August. The current range is 350–375 bps, and CME FedWatch data point to a hold in September (about 67% probability), a year-end range of 375–400 bps, and a meaningful likelihood of an increase this year. A rate cut looks unlikely through 2026–2027.
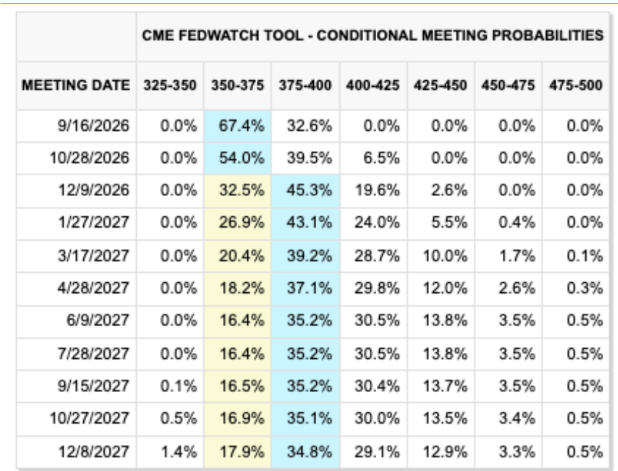
CME FedWatch Tool — Conditional Meeting Probabilities
On the Treasury side, the Treasury curve (Aug 17–18) showed the 2-year at 4.19%, 5-year at 4.36%, 10-year at 4.72%, and 30-year at 5.30%, the highest 30-year yield in roughly 20 years.
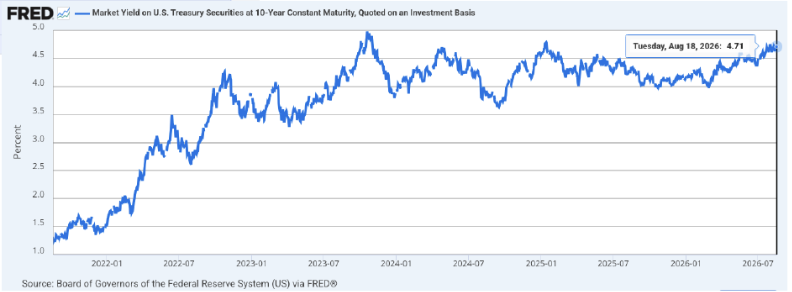
10-Year Treasury Constant Maturity Yield (FRED)
Market consensus has the 10-year Treasury moving above 5% in 2027, and 30-year mortgage rates rising above 7% around the end of this year or early 2027, peaking near 7.2%. Mortgage rates dipped just below 6% in late February, but have since climbed to roughly 6.75–6.80% (Mortgage News Daily), and the consensus path suggests more room to rise before they fall.
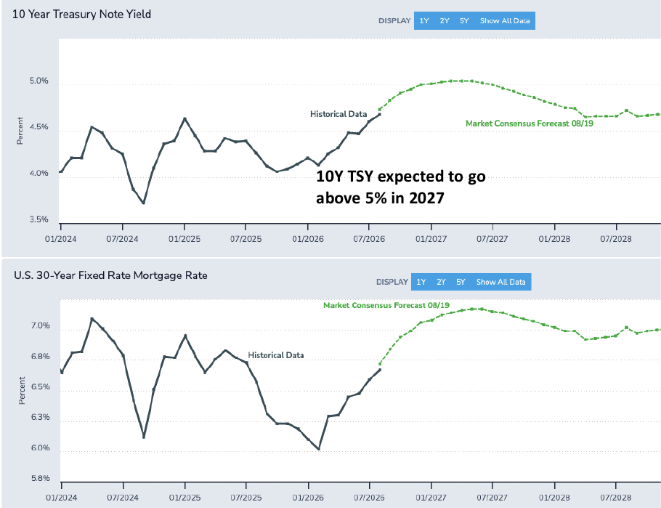
10-Year Treasury and 30-Year Fixed Mortgage Rate — Market Consensus Forecast (as of 8/19)
Inflation, Growth, and Labor
Core inflation has sat around 2.5% for a long time, well above the Fed’s 2% target. Much of the recent volatility in headline inflation, which peaked near 4.2% in May before easing to 3.5% in June and 3.4% in July, has been driven by energy prices. With core measures still elevated, the Fed has little flexibility to cut. The Producer Price Index is also rising, a signal of higher consumer inflation in the coming months, since retailers have limited capacity to absorb further cost increases.
| Inflation Measure | July 2026 | June 2026 | Fed Target |
| CPI (Headline) | 3.4% YoY | 3.5% YoY | 2.0% |
| Core CPI (ex-food/energy) | 2.5% YoY | 2.6% YoY | ~2.0% |
| PCE (Headline) | 3.2% YoY (est.) | 3.3% YoY | 2.0% |
| Core PCE (ex-food/energy) | 2.6% YoY (est.) | 2.7% YoY | 2.0% |
| Energy Component | Fell 5.7% MoM | Up 15.7% YoY | N/A |
Headline vs. Core Inflation
On growth, current estimates put 2026 GDP growth at around 2% (Goldman Sachs at 2.8%, Deloitte at 2.0%), with 2027 expected to be weaker, and Deloitte’s downside scenario is recessionary. The labor market is showing strain: July nonfarm payrolls fell by 23,000, a first-time decline, and June was revised down sharply to +20,000. Unemployment ticked down to 4.1%, but only because labor force participation also fell to 61.4%, and with wage growth slowing to 3.2%, real wages are now negative.
| Labor Market Metric | July | June | Change |
| Nonfarm Payrolls | -23,000 | +20,000 (revised) | -43,000 |
| Unemployment (U-3) | 4.1% | 4.2% | -0.1pp |
| Labor Force Participation | 61.4% | 61.5% | -0.1pp |
| Wage Growth (YoY) | 3.2% | 3.5% | -0.3pp |
| CPI Inflation (YoY) | 3.4% | 3.5% | -0.1pp |
| Real Wage Growth | -0.2% | 0.0% | -0.2pp |
Labor Market, July 2026
Implications for the Housing Market
The Case-Shiller National Home Price Index is still growing, but only about 1% year over year. Persistently high mortgage rates mean little refinance activity, and out-of-the-money loans are likely to stay that way. Homebuilder sentiment has turned negative as costs rise and margins look thin, so housing starts are expected to decline. Builder incentives such as down payment help and rate buydowns, which have supported a significant share of new-home sales in recent years, are coming under pressure.
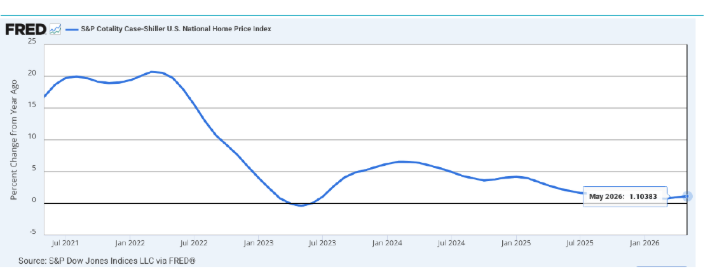
S&P Cotality Case-Shiller U.S. National Home Price Index, YoY % Change
RiskSpan’s view: with few new homes available and builder incentives fading, inventory constraints make a significant home price decline unlikely. Prices should stay close to current levels, with perhaps a moderate increase. Geopolitics remains the major macro driver of markets, so it is worth keeping an eye on.
We continue to add additional analytics reports on the RiskSpan Platform. Please visit www.riskspan.com to request access.
As always, please feel free to contact us to discuss or learn more.