Models & Markets Update: October 2026
Register here for next month’s call: Thursday, November 19th 2026, 1 p.m. ET.
Key Takeaways
- Prepayment models continue to track realized speeds closely, though speeds fell roughly 8% for Fannie/Freddie and 10% for Ginnie this month, and the turnover regime is showing modest over-prediction
- Prepayment Model v3.9, targeted for Q1 2027, re-estimates the model on data through mid-2026 to sharpen out-of-the-money and turnover performance, fix large-loan over-predictions and FHA/VA bias, and add user dials for seasonality, CPR floors, credit score, LTV, and loan size
- The new Non-QM Credit Model 7.1 is trained on non-QM loan-level data with a full transition matrix and doc-type sub-models; run against the September 2026 non-QM universe, it projects 8.2% cumulative defaults (vs. 11.5% under v6.5) and 15 bps of losses (vs. 1.45%)
- Non-QM delinquencies are stable across doc types, but the 2023 vintage keeps underperforming (7.82% D60+), and bank statement loans carry the highest D60+ rate at 3.75%
- Mortgage rates near 7.4% are the highest in roughly two decades outside of late 2023, consensus sees them staying above 7% through 2027, and more than two-thirds of the outstanding universe sits deep out of the money — keeping prepayments firmly in the turnover regime
- Consumer credit is diverging between prime and subprime borrowers, while tight housing inventory continues to support home prices (+2% YoY) absent a severe recession
This month’s call covered prepayment model back-testing with the October factor data, an introduction to Prepayment Model v3.9, non-QM performance trends and the new Non-QM Credit Model 7.1, and the latest macro and housing picture.
You can read the recap below or click here for the entire recording.
Prepayment Model Back-Testing
Speeds slowed this month across the board. In the conventional turnover regime, observed speeds fell about 7.7% for Fannie and 8.1% for Freddie, and the model is running modestly fast versus actuals — possibly reflecting a shift in seasonal patterns. The higher-coupon refinance regime remains more closely in line with actual performance.
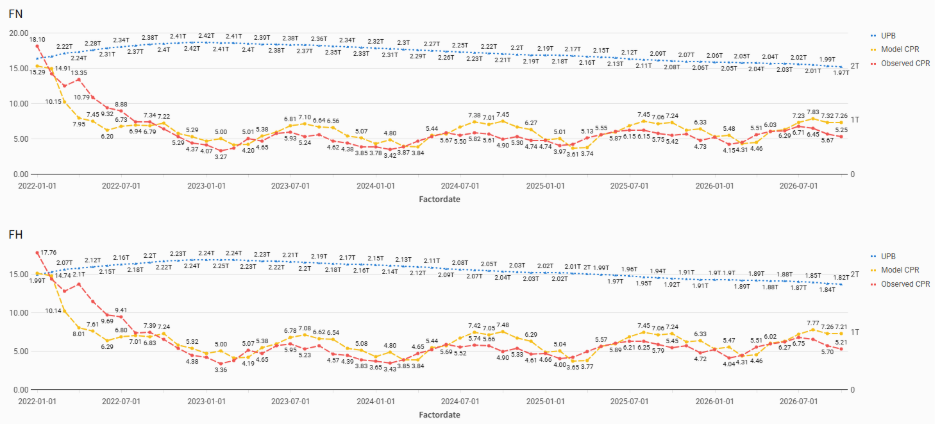
FN/FH WAC 5.5 and Below — Modeled vs. Observed CPR
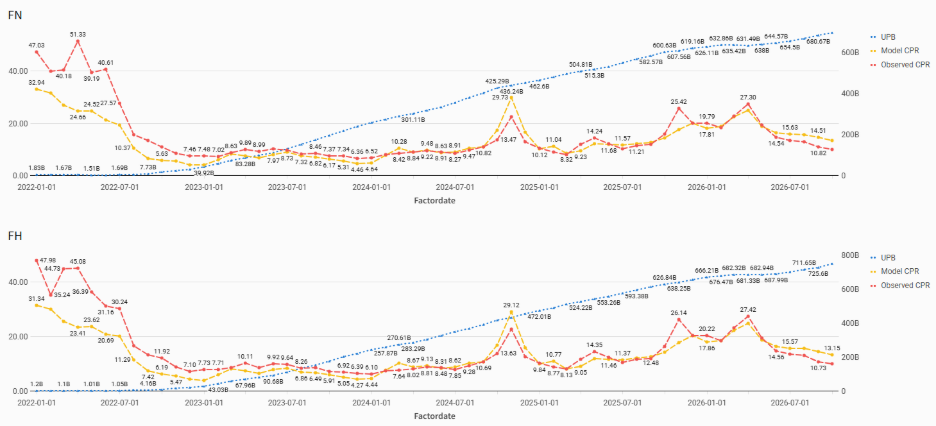
FN/FH WAC 6 and Higher — Modeled vs. Observed CPR
Ginnie speeds fell roughly 10% in both the GN and G2 cohorts. As flagged on previous calls, the model continues to over-predict FHA speeds and under-predict VA speeds. Both issues, along with the seasonal shift in conventionals, are being addressed in v3.9. The full interactive backtesting dashboards are available in the RiskSpan platform under RS Insights.
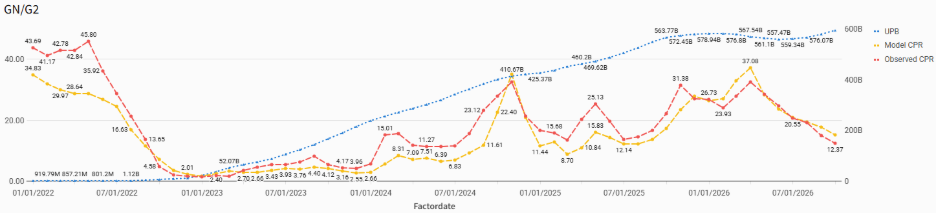
GN/G2 WAC 5.5 and Below — Modeled vs. Observed CPR
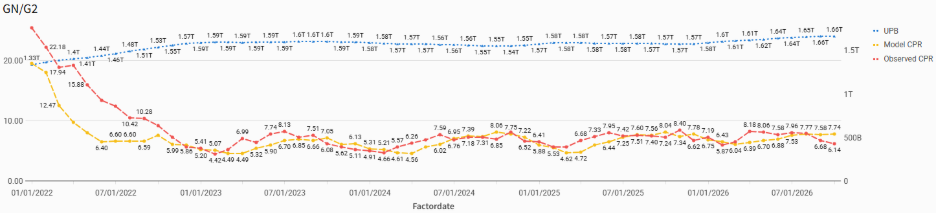
GN/G2 WAC 6 and Higher — Modeled vs. Observed CPR
Prepayment Model v3.9
v3.9 re-estimates the agency prepayment model using performance data through mid-2026, with a release targeted for Q1 2027. The goals are better out-of-the-money performance and refinance modeling in a high-rate regime, and a fix for the over-prediction of large-balance loans, which have become more common post-COVID as conforming loan limits rose.
The re-estimation covers the turnover and refinance components of the conventional 30- and 15-year models and the FHA and VA 30-year models, and the ARM prepayment model is also being revisited. The release will expose new knobs for seasonality adjustment, turnover and refinance CPR floors, and native dials by credit score, LTV, and loan size. Model projections will also break out turnover and refinance components separately.
With more than two-thirds of the outstanding mortgage universe deep out of the money, turnover will drive speeds for some time, which is why it is the focus of this release.
Non-QM Performance and Credit Model 7.1
Delinquency Trends
Non-QM D60+ rates remain stable across documentation types. Bank statement loans have the highest D60+ rate at 3.75%, partly explained by their lower FICOs. The 2023 vintage continues to underperform, at 7.82% D60+ and 10.80% D30+. Part of that is likely credit burnout: higher WACs pushed stronger borrowers to pay off, leaving a weaker pool. The 2023 vintage also has the lowest average FICO and the highest share of bank statement and “other” loans.
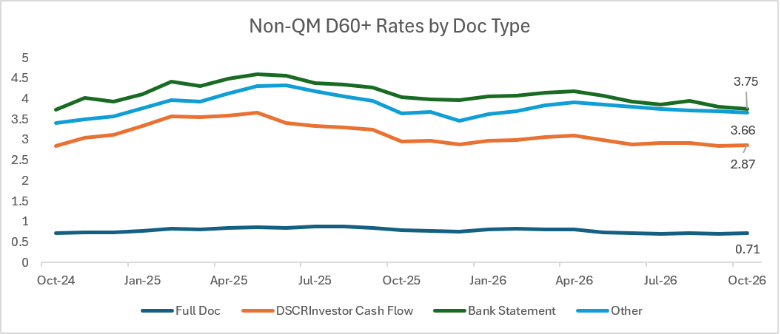
Non-QM D60+ Rates by Doc Type
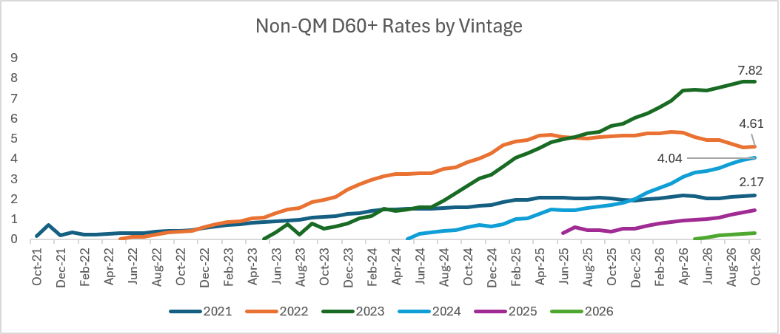
Non-QM D60+ Rates by Vintage
DSCR, full doc, and bank statement loans make up about 84% of non-QM. The smaller doc types within “other” are too thin to model separately, but their performance varies widely, with D60+ rates ranging from under 1% for asset qualifiers to over 5% for CPA-certified P&L loans. Clients with concentrated exposure to any of these types may want to adjust their model assumptions accordingly.
Model Specification
Credit Model 7.1 is a significant step up from the prior version. It is trained on non-QM loan-level data from CoreLogic rather than the pre-GFC Alt-A loans used previously. Transition rates are estimated on data from January 2018 through August 2025 (excluding March–September 2020), and liquidation and severity models use performance data through May 2026.
The structure now mirrors RiskSpan’s Agency Credit Model 7.0: a full transition matrix in which each transition is modeled independently with a multinomial logistic regression, replacing the prior two-state performing/non-performing model. Separate sub-models are estimated for each of the four major doc types (DSCR, full doc, bank statement, and other), aligned with the non-QM prepayment model, since a single set of coefficients could not capture the dispersion in performance across them. Key drivers include FICO, mark-to-market LTV, DTI, SATO, loan age, loan size, loan purpose, occupancy, DSCR ratio, and prepayment penalties, along with HPI, unemployment, and mortgage rates.
A few other details worth noting:
- Pre-REO liquidation rates are set to historically observed averages because the data was too thin to estimate them; they are exposed to users and default to zero for current and D30 loans
- REO liquidations come from the agency model, calibrated to non-QM performance
- Prepayments come directly from Non-QM Prepayment Model v3.11, applied to current, D30, and D60 loans (D60 prepayments default to zero but can be adjusted)
- Severity is re-estimated on an expanded default definition — any termination to zero balance from D60+ — which brings in many zero-severity short sales; for mark-to-market LTVs above 80, where non-QM data is thin, the model uses agency GFC-era LTV splines to preserve sensitivity in stress scenarios
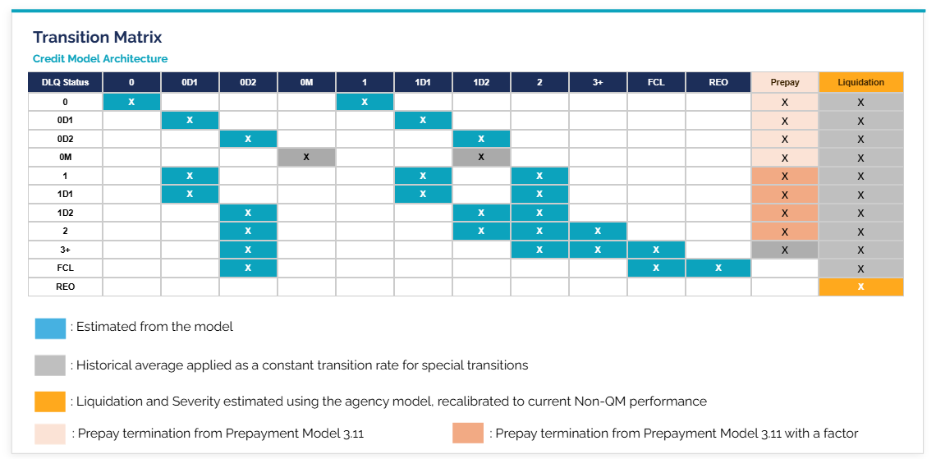
Credit Model 7.1 — Non-QM Transition Matrix
Impact Analysis
Running the September 2026 non-QM universe through v7.1, projected cumulative defaults fall from 11.5% under production v6.5 to 8.2%, with bank statement loans roughly flat. Average severity drops from 12.6% to 1.8%, and cumulative losses fall from 1.45% to 15 bps, reflecting the very low severities observed on non-QM liquidations. Outside of REO, projected defaults are lower for every performance status, reflecting the much higher cure rates in non-QM data compared with the legacy data behind v6.5.


Base Case Production Impact Analysis: v7.1 vs. v6.5
The model responds meaningfully to home price stress. Moving from the base case (about 3% annual HPA) to flat HPI raises defaults from 8.2% to 9.5% and losses from 15 to 22 bps. Under a severely adverse scenario with home prices falling at least 30%, defaults rise to 21%, losses to 94 bps, and severity to 4.5%.


Impact Analysis: HPI Sensitivity
Credit Model 7.1 is available to all RiskSpan clients. Please reach out to your RiskSpan contact if you’d like to try it.
Macroeconomic Update
The Fed funds rate is expected to stay high. CPI came in at 3.7% the week of the call, and while a hike at the late-October meeting looked unlikely, CME FedWatch data points to one increase before year-end, taking the current 375–400 bps range to 400–425 bps. A cut looks unlikely through 2026–2027.
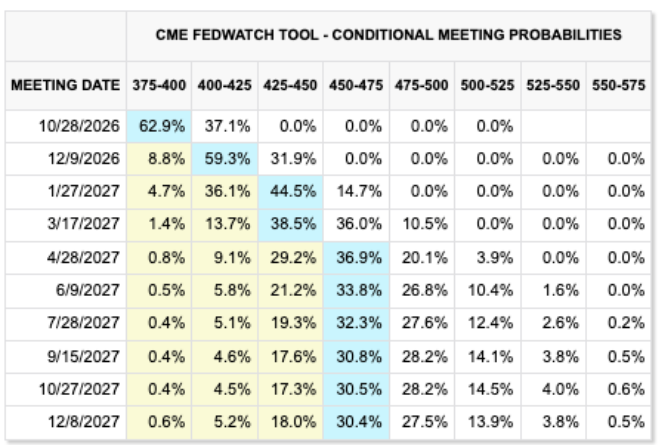
CME FedWatch Tool — Conditional Meeting Probabilities
The Treasury curve has shifted up roughly 30 bps in a near-parallel move over the past month. The 10-year reached about 5.22% and the 30-year about 5.55% the day before the call, though the 10-year rallied to around 5.05–5.10% on the day of the call.

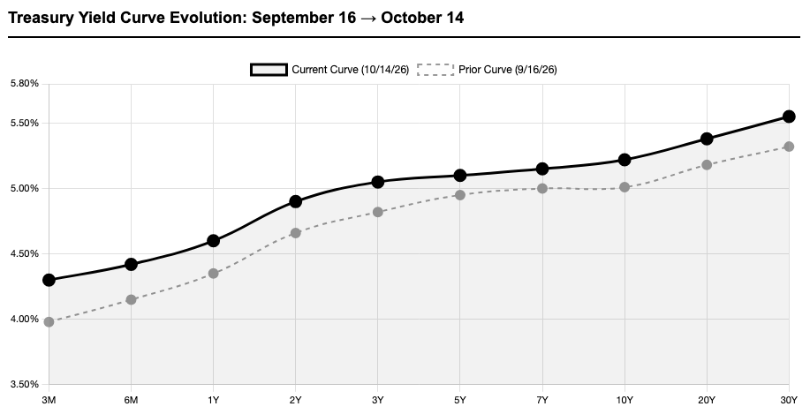
Treasury Par Yield Curve: Current vs. 30 Days Prior
The 30-year mortgage rate is around 7.4% (Freddie Mac), with Mortgage News Daily briefly near 7.65%. Setting aside the October 2023 spike to nearly 8%, that is the highest level in roughly 22 years. Consensus forecasts have the 10-year staying above 5% until July 2028 and mortgage rates unlikely to fall below 7% over the next two years, at about 7.1% two years out. That keeps prepayments in the turnover regime for the foreseeable future.
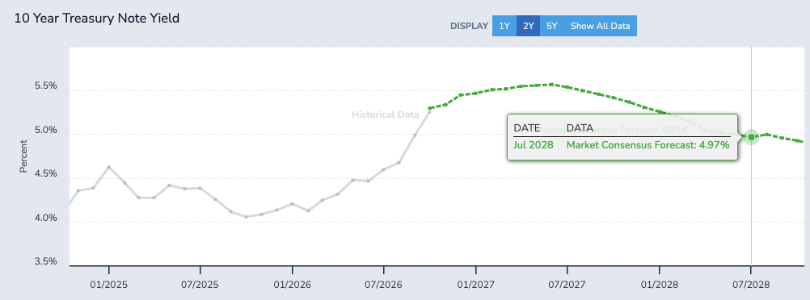
10-Year Treasury Yield — Market Consensus Forecast
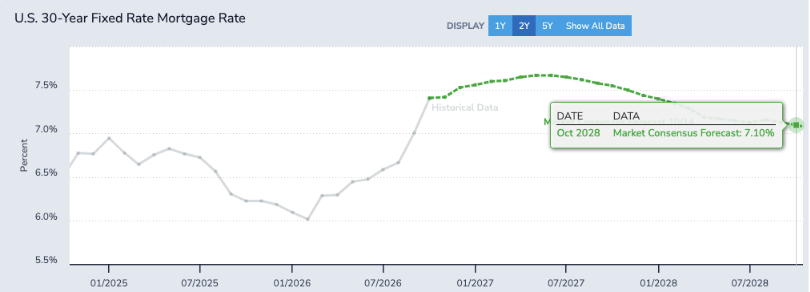
30-Year Fixed Mortgage Rate — Market Consensus Forecast
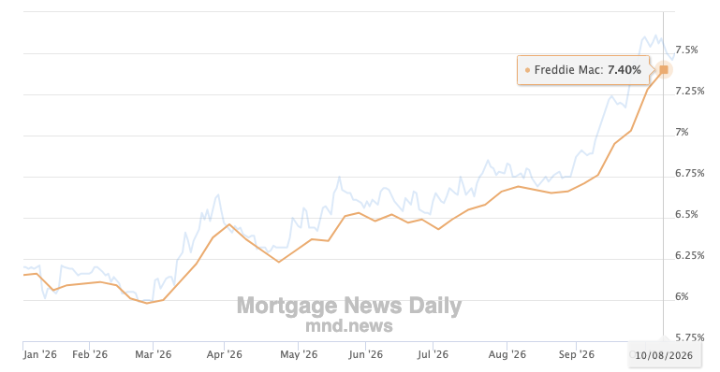
30-Year Fixed Mortgage Rate (Mortgage News Daily / Freddie Mac)
Consumer credit is showing a growing split between prime and subprime borrowers. Subprime auto 60+ delinquencies are around 6.8%, just off a historic high above 7%, while prime auto delinquencies remain muted. Credit card delinquencies are about 2.7% overall but above 11% for subprime. Mortgage delinquencies are 4.37% per the MBA, but FHA delinquencies exceed 10%. Auto credit has historically been a leading indicator for mortgages, so it bears watching.

Consumer Credit Delinquency Snapshot
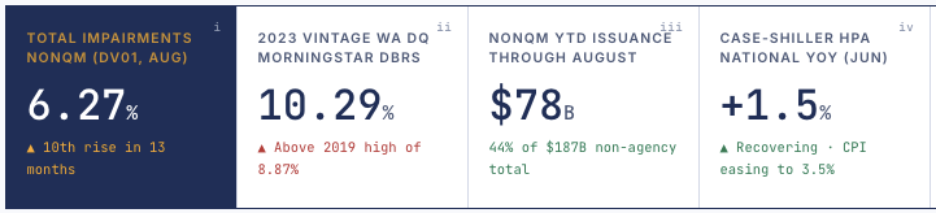
In non-QM, total impairments are about 6.25% per dv01, the tenth increase in 13 months, and the 2023 vintage’s 30+ delinquency rate has topped 10%. Even so, the market keeps growing: non-QM issuance reached $78 billion through August and is on pace for roughly $120 billion by year-end.
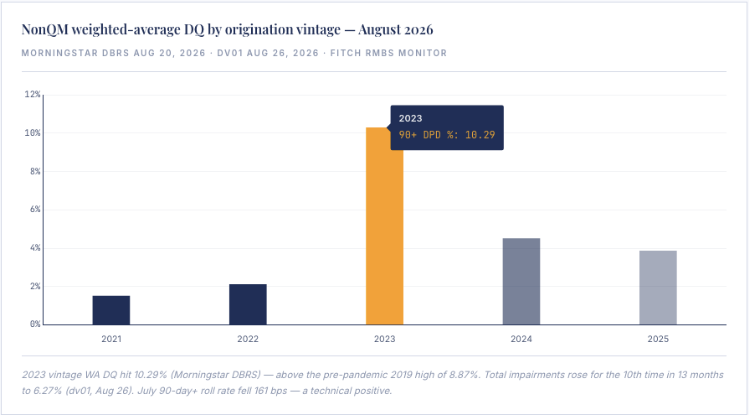
Non-QM Weighted-Average Delinquency by Origination Vintage
The Case-Shiller National Home Price Index has been in positive territory for more than three years, with the latest reading at 2% YoY. Homebuilder sentiment is negative, housing starts have fallen sharply, and the builder incentives that supported new home sales in 2025 are under pressure as mortgage rates have climbed from their February low just under 6%. Fewer new homes and lock-in among existing owners keep inventory tight.
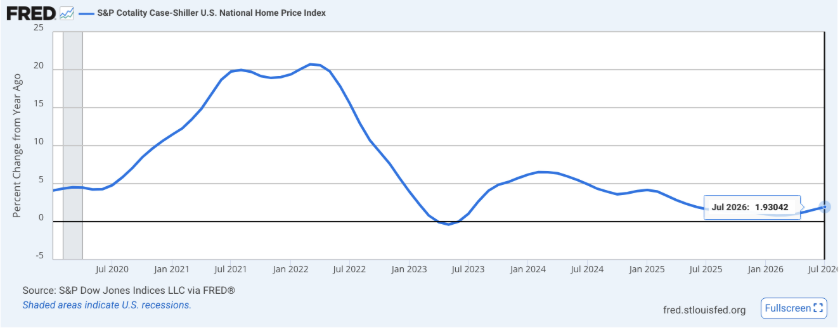
S&P Cotality Case-Shiller U.S. National Home Price Index, YoY % Change
RiskSpan’s view: that inventory scarcity should keep home prices from falling significantly unless there is a severe recession, though the probability of one has been rising.
We continue to add additional analytics reports on the RiskSpan Platform. Please visit riskspan.com to request access.
As always, please feel free to contact us at info@riskspan.com to discuss or learn more.