
No such thing as a free lunch.
The world is full of free (and semi-free) datasets ripe for the picking. If it’s not going to cost you anything, why not supercharge your data and achieve clarity where once there was only darkness?
But is it really not going to cost you anything? What is the total cost of ownership for a public dataset, and what does it take to distill truly valuable insights from publicly available data? Setting aside the reliability of the public source (a topic for another blog post), free data is anything but free. Let us discuss both the power and the cost of working with public data.
To illustrate the point, we borrow from a classic RiskSpan example: anticipating losses to a portfolio of mortgage loans due to a hurricane—a salient example as we are in the early days of the 2020 hurricane season (and the National Oceanic and Atmospheric Administration (NOAA) predicts a busy one). In this example, you own a portfolio of loans and would like to understand the possible impacts to that portfolio (in terms of delinquencies, defaults, and losses) of a recent hurricane. You know this will likely require an external data source because you do not work for NOAA, your firm is new to owning loans in coastal areas, and you currently have no internal data for loans impacted by hurricanes.
Know the Data.
The first step in using external data is understanding your own data. This may seem like a simple task. But data, its source, its lineage, and its nuanced meaning can be difficult to communicate inside an organization. Unless you work with a dataset regularly (i.e., often), you should approach your own data as if it were provided by an external source. The goal is a full understanding of the data, the data’s meaning, and the data’s limitations, all of which should have a direct impact on the types of analysis you attempt.
Understanding the structure of your data and the limitations it puts on your analysis involves questions like:
- What objects does your data track?
- Do you have time series records for these objects?
- Do you only have the most recent record? The most recent 12 records?
- Do you have one record that tries to capture life-to-date information?
Understanding the meaning of each attribute captured in your data involves questions like:
- What attributes are we tracking?
- Which attributes are updated (monthly or quarterly) and which remain static?
- What are the nuances in our categorical variables? How exactly did we assign the zero-balance code?
- Is original balance the loan’s balance at mortgage origination, or the balance when we purchased the loan/pool?
- Do our loss numbers include forgone interest?
These same types of questions also apply to understanding external data sources, but the answers are not always as readily available. Depending on the quality and availability of the documentation for a public dataset, this exercise may be as simple as just reading the data dictionary, or as labor intensive as generating analytics for individual attributes, such as mean, standard deviation, mode, or even histograms, to attempt to derive an attribute’s meaning directly from the delivered data. This is the not-free part of “free” data, and skipping this step can have negative consequences for the quality of analysis you can perform later.
Returning to our example, we require at least two external data sets:
- where and when hurricanes have struck, and
- loan performance data for mortgages active in those areas at those times.
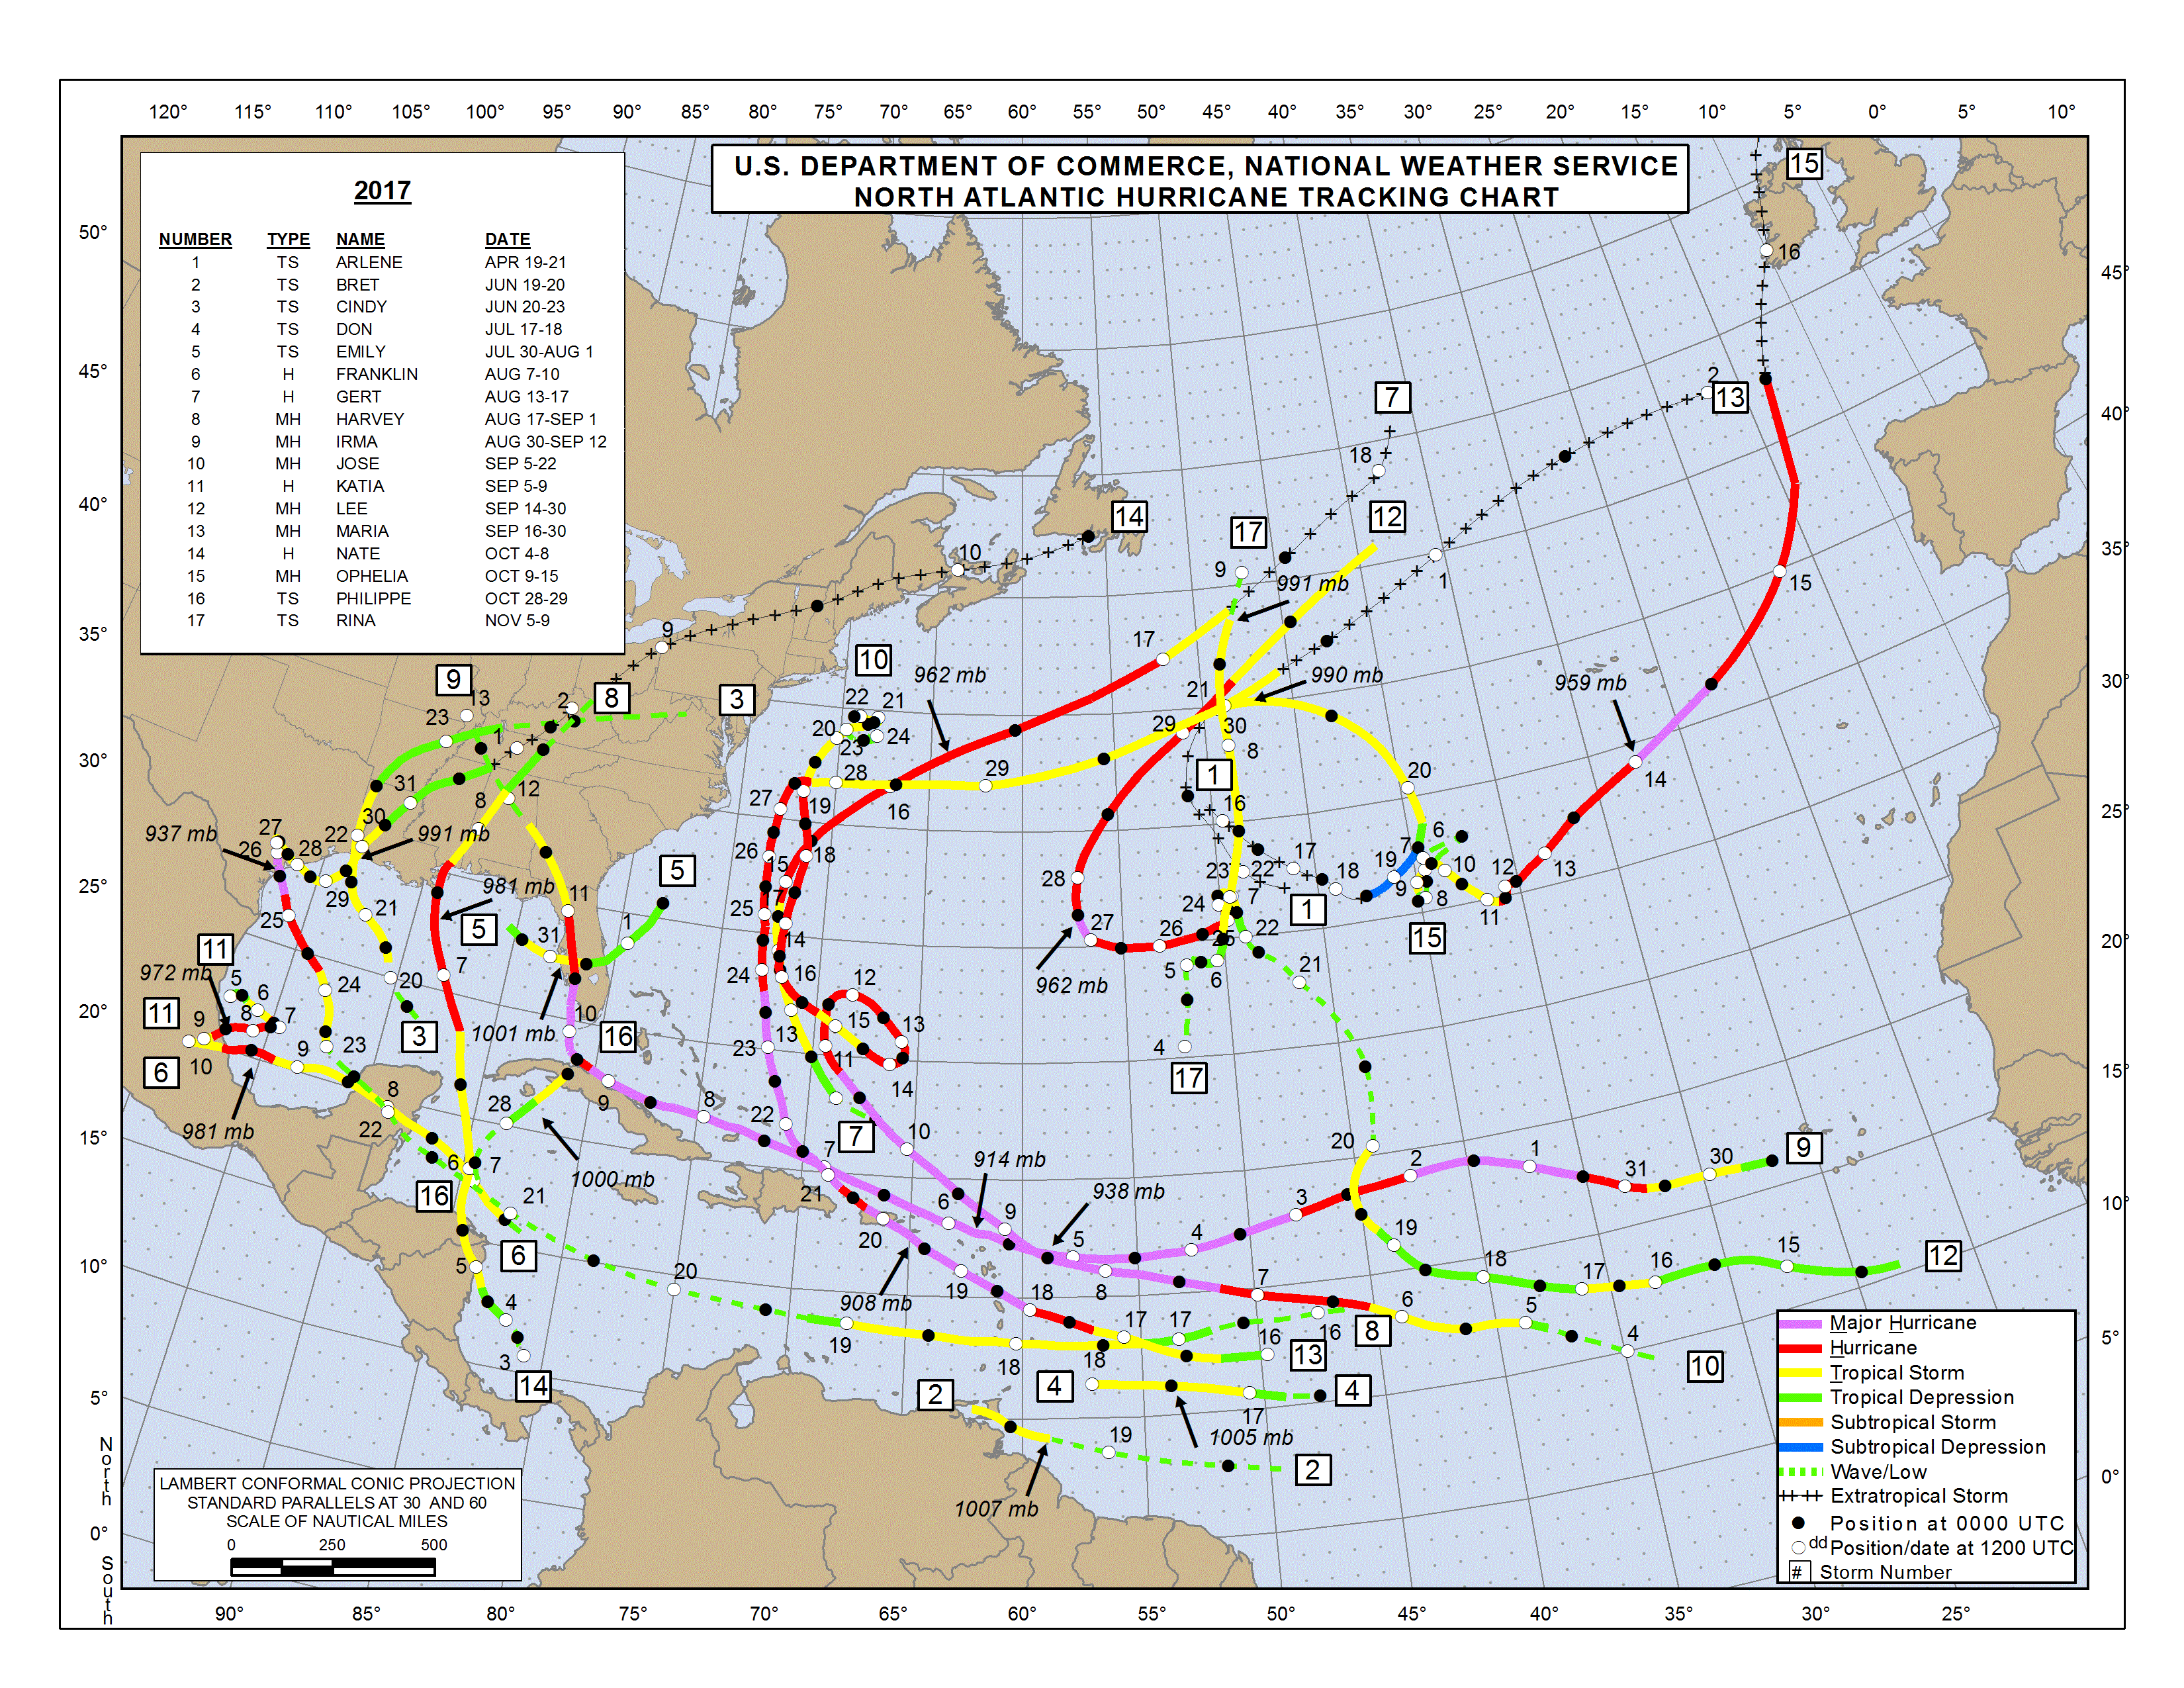
The obvious choice for loan performance data is the historical performance datasets from the GSEs (Fannie Mae and Freddie Mac). Providing monthly performance information and loss information for defaulted loans for a huge sample of mortgage loans over a 20-year period, these two datasets are perfect for our analysis. For hurricanes, some manual effort is required to extract date, severity, and location from NOAA maps like these (you could get really fancy and gather zip codes covered in the landfall area—which, by leaving out homes hundreds of miles away from expected landfall, would likely give you a much better view of what happens to loans actually impacted by a hurricane—but we will stick to state-level in this simple example).
Make new data your own.
So you’ve downloaded the historical datasets, you’ve read the data dictionaries cover-to-cover, you’ve studied historical NOAA maps, and you’ve interrogated your own data teams for the meaning of internal loan data. Now what? This is yet another cost of “free” data: after all your effort to understand and ingest the new data, all you have is another dataset. A clean, well-understood, well-documented (you’ve thoroughly documented it, haven’t you?) dataset, but a dataset nonetheless. Getting the insights you seek requires a separate effort to merge the old with the new. Let us look at a simplified flow for our hurricane example:
- Subset the GSE data for active loans in hurricane-related states in the month prior to landfall. Extract information for these loans for 12 months after landfall.
- Bucket the historical loans by the characteristics you use to bucket your own loans (LTV, FICO, delinquency status before landfall, etc.).
- Derive delinquency and loss information for the buckets for the 12 months after the hurricane.
- Apply the observed delinquency and loss information to your loan portfolio (bucketed using the same scheme you used for the historical loans).
And there you have it—not a model, but a grounded expectation of loan performance following a hurricane. You have stepped out of the darkness and into the data-driven light. And all using free (or “free”) data!
Hyperbole aside, nothing about our example analysis is easy, but it plainly illustrates the power and cost of publicly available data. The power is obvious in our example: without the external data, we have no basis for generating an expectation of losses after a hurricane. While we should be wary of the impacts of factors not captured by our datasets (like the amount and effectiveness of government intervention after each storm – which does vary widely), the historical precedent we find by averaging many storms can form the basis for a robust and defensible expectation. Even if your firm has had experience with loans in hurricane-impacted areas, expanding the sample size through this exercise bolsters confidence in the outcomes. Generally speaking, the use of public data can provide grounded expectations where there had been only anecdotes.
But this power does come at a price—a price that should be appreciated and factored into the decision whether to use external data in the first place. What is worse than not knowing what to expect after a hurricane? Having an expectation based on bad or misunderstood data. Failing to account for the effort required to ingest and use free data can lead to bad analysis and the temptation to cut corners. The effort required in our example is significant: the GSE data is huge, complicated, and will melt your laptop’s RAM if you are not careful. Turning NOAA PDF maps into usable data is not a trivial task, especially if you want to go deeper than the state level. Understanding your own data can be a challenge. Applying an appropriate bucketing to the loans can make or break the analysis. Not all public datasets present these same challenges, but all public datasets present costs. There simply is no such thing as a free lunch. The returns on free data frequently justify these costs. But they should be understood before unwittingly incurring them.


