A Case Study for Mortgage Investors
If the answer is developer hours saved, I think we’re measuring the easy part — and missing the bigger prize.
The problem isn’t information. It’s acting on it.
The information an investor needs mostly exists already. It just arrives scattered — emails, dealer commentary, internal reporting, a dozen data feeds. Tracking all the sources is hard enough. Deriving insight and acting on it in time? Nearly impossible at human speed.
The first-order ROI is real — and one-time
Yes, AI automates the collection. Yes, AI coding tools can stand up the dashboard that aggregates everything, with drill-downs. That’s real ROI, and worth capturing. But it’s one-time ROI: the savings recur, but the capability doesn’t compound. Your highest-value people are still going through the motions: clicking, drilling, hunting for the missing piece, deciding what to look at next.
The durable ROI is different
It comes from making the high-value portfolio manager (PM) and the uber-analyst more powerful. Not summaries — actions: sharper pricing, less leakage through better risk management, new sources of return spotted as market conditions evolve.
The tech world calls the machinery “loops enhanced by graph engineering.” Strip the jargon and it’s simple: workflows that manage dependencies and put human validation gates at the decision points. Software developers have been working this way for months — sometimes without naming it. The processes translate to investing better than you’d expect.
Two properties do most of the work.
First: the graph
The workflow maps which tasks actually depend on which. Everything independent runs in parallel — that’s speed. Results synchronize before a decision is staged — that’s fewer half-formed questions thrown back at you. The PM gets one decision point with the evidence assembled, not twenty interruptions.
Second — and this is the part I find most interesting: unknown unknowns
Newer models can reason much longer and more carefully than the last generation, and one consequence is underappreciated: they are effective at surfacing gaps in your own framing. There is a specific class of unknown unknowns — things well-represented in the model’s knowledge but outside yours — that a model can convert into explicit questions. You’re watching delinquencies by geography; it asks whether insurance-premium shocks in those same markets belong on the dashboard. You benchmark refi incentive to a survey average; it asks what lenders are actually offering that borrower today.
That’s a genuine and valuable capability. Here’s the trap: believing that a “what am I missing?” pass gives you coverage. It doesn’t. Run it ad hoc and you get a different, unaudited coverage claim every time.
So we use the capability where it belongs — at design time. When we build a loop, human and AI iterate on what the loop should watch, and the blind spot questions get argued out once, deliberately, by people who know the portfolio. Then the answers are committed to a deterministic pipeline: the same checks, every run, written down. Coverage becomes explicit and auditable — not an assumption remade on every prompt. And when something does slip through, it doesn’t just get fixed; it becomes a permanent regression test the system must pass forever.
Coverage compounds. That’s the difference between a workflow and a chat window.
What this looks like in practice
We started with non-QM (non-qualified mortgage) investors. The loops we’re building:
- Pricing — wholesale rate sheets parsed daily; every program and pricing change diffed against the market
- Market intelligence — new deals scored rich or cheap — over- or underpriced — vs comparables the day they price; street commentary attributed to its source and date, never blended into an unattributed consensus
- Asset allocation — where return is migrating as conditions evolve: primary vs secondary market, cohort vs cohort
- Risk & outliers — roll rates (how delinquencies migrate from 30 to 60 to 90 days late), concentrations, and the checks that separate borrower credit deterioration from a soft local housing market
- News & regulatory scanners — policy, litigation, counterparty watch, with two independent sources behind any credit-negative claim
- Macro — the weekly backdrop every other loop cites, so context is shared instead of re-derived
Case study: a mortgage investor’s morning in the pricing loop
Here’s one of those loops in the wild — a demonstration run on live market data from this August.
A non-QM investor’s earliest view of the primary market lives in wholesale rate sheets: nine lenders in this build, each publishing rate grids and adjustment matrices in its own format, on its own schedule. Read together, they’re a running record of who wants what risk at what price. Almost nobody reads them together. The realistic before-state isn’t a team parsing nine sheets every morning — it’s an analyst spot-checking two or three when a deal is in play, and everything else surfacing weeks later, if at all.
The loop runs before the market day starts. It fetches and parses every sheet, then works as a graph: nine lenders in parallel, every price cell and every adjustment diffed against that lender’s own history, results synchronizing only where the analysis genuinely needs all nine — cross-lender dispersion, and the comparison against where benchmarks moved. All arithmetic runs in SQL against the loaded data, never inside the model, and every number keeps a link back to the exact source file it came from. That morning: 20,000+ data points scanned.
What reached the PM was not 20,000 data points. The gates — freshness checks, numeric reconciliation, materiality thresholds, an independent model challenging the findings — cut it to six candidate findings, of which five survived the challenge — two material signals and three escalations — staged as a single review that took about fifteen minutes. The diagram below shows that morning end to end.
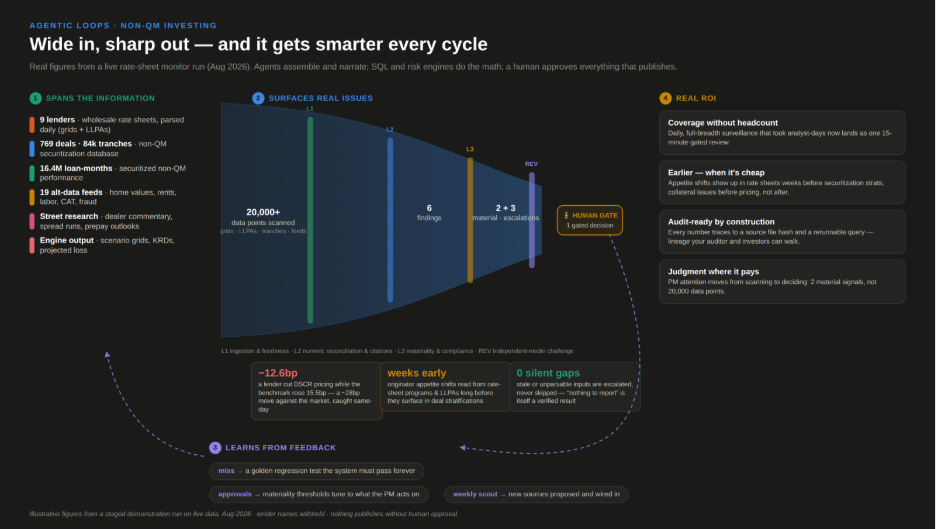
The material catch: one lender had cut pricing on DSCR loans (investor-property loans underwritten on rental cash flow) by 12.6 basis points (hundredths of a percent) the same morning benchmark mortgage rates moved 15.5bp the other way — roughly a 28bp swing against the market, caught same-day. That’s valuable twice. Tactically, it’s better information for anyone pricing or bidding that collateral this week. Strategically, it’s an appetite signal: an originator reaching for volume shows up in its rate sheet weeks before it shows up in the collateral of the deals you’ll be offered. Wait for the deal stratifications — the collateral tables published when a deal comes to market — and you’re reading old news.
The three escalations matter just as much. Three of the nine sources came in stale or unparsable that morning, and the loop escalated them instead of skipping them — so “nothing new from the other six” is a verified statement, not an assumption. That’s the unglamorous half of the ROI: gates are what keep silent gaps from quietly turning your coverage claim into fiction.
The ledger for that single morning: full-breadth coverage that used to cost analyst-days, delivered as a fifteen-minute gated review. A signal in hand weeks earlier than the alternative. An audit trail your risk committee — or your investors — can walk from any number back to a source file and a rerunnable query. And the PM’s judgment spent on two decisions, not twenty thousand data points.
The loop part matters most: every approval or correction at the gate tunes what the system treats as material, and every miss becomes a new golden test. It gets smarter every cycle.
So how do we measure the ROI?
- Headcount the PM would have needed — sure, but that one’s overdone
- Basis points of better pricing across the book — what would 1bp be worth in yours?
- The wrong decision you didn’t make — the fraud flag or the stale input caught before anything was priced off it
- And the verification gates themselves. Unchecked AI doesn’t produce zero ROI; it can produce negative ROI. The gates are what keep the sign positive.
How are you measuring yours? What’s the decision in your process that arrives too late today?
If you’re building toward something similar — or stuck in dashboard land — please message me. Happy to compare notes.
As securitization models become increasingly complex and differentiated, validation becomes a critical challenge. We’ve experimented with an innovative approach that leverages large language models (LLMs) as impartial judges to validate models implemented across different platforms.
The Dual-Implementation Challenge
In cash flow modeling, we often maintain parallel implementations—typically in Python for flexibility and Excel for transparency. How do we ensure both versions produce consistent results?
Enter the “LLM as Judge” approach!
A Real-World Case Study: Residential Transition Loan Funding
Consider a portfolio of residential transition loans with a funding structure including:
- 100 loans averaging $275,000 each
- 12-month average terms at 8.75%
- A 75% advance rate
- 2% loss reserve build-up
- Performance triggers based on delinquency rates
We implemented this structure in both Python and Excel, then submitted both models to an LLM for validation.
The LLM Validation Process
The LLM first analyzed the conceptual alignment between models, confirming both followed the same fundamental approach to cash flow projection, default assumptions, reserve mechanics, and triggers.
Next came a rigorous numerical comparison. The LLM detected a $100,000 investor distribution discrepancy in Month 2:
- Python model: $1,790,702
- Excel model: $1,690,702
Through logical analysis, the LLM determined this likely stemmed from differently evaluated trigger conditions. This kind of subtle implementation difference could easily go unnoticed in manual validation, potentially leading to significant valuation discrepancies over time.
Beyond Discrepancy Detection
The true power of this approach extends beyond finding differences. The LLM also provided:
- Stress testing recommendations tailored to our specific product, including scenarios for rapid defaults, extension waves, and interest rate shocks
- Model risk management insights highlighting documentation needs and suggesting a formal reconciliation process
- Code quality assessment noting strengths and weaknesses in both implementations
Why This Matters
For securitization professionals, this approach offers several advantages:
- Efficiency: Automation of tedious line-by-line comparisons
- Comprehensiveness: Identification of conceptual differences, not just numerical ones
- Regulatory compliance: Better documentation for model risk management requirements
- Objectivity: Unbiased third-party perspective
Read the full S&P Global Market Intelligence case study: https://riskspan.com/spgmi-case-study-cecl-coverage/
Meeting the CECL standard shouldn’t mean draining internal resources or compromising earnings confidence. Yet for one insurance company, a legacy CECL provider did just that—leaving major gaps in asset class coverage, opaque methodologies, and audit headaches in its wake.
This case study highlights how switching to RiskSpan and S&P Global Market Intelligence turned things around. Together, we delivered a fully managed CECL solution that provides complete portfolio coverage, robust auditability, and significant efficiency gains.
Powered by S&P’s macroeconomic scenarios and backed by RiskSpan’s platform, the solution gave the insurer stronger confidence in its estimates, streamlined audit reviews, and freed up key staff to focus on higher-value work.
For investors and finance teams evaluating CECL providers, this success story underscores the value of working with a partner that combines top-tier data, flexible modeling, and hands-on support.
Read the full case study and see how RiskSpan and S&P Global Market Intelligence make CECL compliance a strategic advantage.
Learn more about how one whole loan and MSR investor (a large mortgage REIT) successfully overhauled its analytics computational processing with RiskSpan. The investor migrated from a daily pricing and risk process that relied on tens of thousands of rep lines to one capable of evaluating each of the portfolio’s more than three-and-a-half million loans individually (and how they actually saved money in the process).
The Situation
One of the industry’s largest mortgage REITs sought a more forward-thinking way of managing its extensive investment portfolio of mortgage servicing rights (MSR) assets, residential loans and securities. The REIT runs a battery of sophisticated risk management analytics that rely on stochastic modeling. Option-adjusted spread, duration, convexity, and key rate durations are calculated based on more than 200 interest rate simulations.
The investor used rep lines for one main reason: it needed a way to manage computational loads on the server and improve calculation speeds. Secondarily, organizing the loans in this way simplified the reporting and accounting requirements to a degree (loans financed by the same facility were grouped into the same rep line).
This approach had some significant downsides. Pooling loans by finance facility was sometimes causing loans with different balances, LTVs, credit scores, etc., to get grouped into the same rep line. This resulted in prepayment and default assumptions getting applied to every loan in a rep line that differed from the assumptions that likely would have been applied if the loans were being evaluated individually.
The Challenge
The main challenge was the investor’s MSR portfolio—specifically, the volume of loans needing to be run. Having close to 4 million loans spread across nine different servicers presented two related but separate sets of challenges.
The first set of challenges stemmed from needing to consume data from different servicers whose file formats not only differed from one another but also often lacked internal consistency. Even the file formats from a single given servicer tended to change from time to time. This required RiskSpan to continuously update its data mappings and (because the servicer reporting data is not always clean) modify QC rules to keep up with evolving file formats.
The second challenge related to the sheer volume of compute power necessary to run stochastic paths of Monte Carlo rate simulations on 4 million individual loans and then discount the resulting cash flows based on option adjusted yield across multiple scenarios.
And so there were 4 million loans times multiple paths times one basic cash flow, one basic option-adjusted case, one up case, and one down case—it’s evident how quickly the workload adds up. And all this needed to happen on a daily basis.
To help minimize the computing workload, the innovative REIT had devised a way of running all these daily analytics at a rep-line level—stratifying and condensing everything down to between 70,000 and 75,000 rep lines. This alleviated the computing burden but at the cost of decreased accuracy because they could not look at the loans individually.
The Solution
The analytics computational processing RiskSpan implemented ignores the rep line concept entirely and just runs the loans. The scalability of our cloud-native infrastructure enables us to take the nearly four million loans and bucket them equally for computation purposes. We run a hundred loans on each processor and get back loan-level cash flows and then generate the output separately, which brings the processing time down considerably.
For each individual servicer, RiskSpan leveraged its Smart Mapper technology and Configurable QC feature in its Edge Platform to create a set of optimized loan files that can be read and rendered “analytics-ready” very quickly. This enables the loan-level data to be quickly consumed and immediately used for analytics without having to read all the loan tapes and convert them into a format that an analytics engine can understand. Because RiskSpan has “pre-processed” all this loan information, it is immediately available in a format that the engine can easily digest and run analytics on.
What this means for you
An investor in any mortgage asset benefits from the ability to look at and evaluate loan characteristics individually. The results may need to be rolled up and grouped for reporting purposes. But being able to run the cash flows at the loan level ultimately makes the aggregated results vastly more meaningful and reliable. A loan-level framework also affords whole-loan and securities investors the ability to be sure they are capturing the most important loan characteristics and are staying on top of how the composition of the portfolio evolves with each day’s payoffs.
A leading investment management firm and recognized leader in structured credit, including asset-backed securities (ABS), mortgage-backed securities (MBS), and other fixed-income sectors, sought RiskSpan’s help transitioning key data processing functions from the data management platform 1010data to Snowflake.
The ability to share data with partners using the same system in which the analytics are performed made the combination of RiskSpan and Snowflake especially attractive. The shift provided significant operational and financial benefits to the client, marking another successful milestone in RiskSpan’s history of helping clients optimize their data management.
Converting Key Functionalities from 1010data to Snowflake
The company had been relying on 1010data for several critical timeseries-based calculations. However, the limitations of the platform—both in terms of speed and cost—prompted them to seek a more modern solution. RiskSpan worked closely with them to replicate and enhance key functionalities using Snowflake. Converted functionalities included:
- Timeseries-Based Calculations: We re-engineered these to operate efficiently within Snowflake’s cloud-native architecture, maintaining accuracy while enhancing processing speeds.
- fill_nearest: This function retrieves the nearest non-N/A value within a group. It was implemented seamlessly using Snowflake’s window functions, preserving data integrity while boosting performance.
- rolling_sum: Snowflake’s SQL capabilities were leveraged to implement the moving sum of valid (non-N/A) values within a window. This provided the company with more responsive and scalable time-series analysis capabilities.
- cumulative_run_length: The cumulative run length within a group was translated into Snowflake’s environment using efficient SQL queries, making the entire process faster and more robust.
Integration Capabilities
In addition to replicating 1010data’s core functionalities, the company sought to expand its data capabilities by integrating additional datasets such as Market Data and Home Price Indices (HPI). We showed them how to incorporate and analyze these datasets within Snowflake’s environment, further enhancing their decision-making capabilities.
This cross-functional integration was pivotal in showcasing Snowflake’s ability to streamline complex data workflows. By integrating third-party data directly into their ecosystem, our client can now generate more insightful reports and conduct deeper analysis across multiple datasets without leaving the Snowflake platform.
The Benefits of Transitioning to Snowflake
Our client experienced several immediate and impactful benefits by transitioning from 1010data to Snowflake were immediate and impactful. These included:
- Complete Replacement of 1010data: With all critical functionalities successfully converted, the company now can fully discontinue their reliance on 1010data. This eliminates the need for maintaining multiple platforms and simplifies their technology stack.
- Significant Cost Savings: Discontinuing 1010data relieved our client of the high costs associated with the platform’s licensing and maintenance fees. Snowflake’s cost-efficient pricing model has already resulted in substantial savings for the company.
- Improved Processing Speeds: One of the most noticeable changes has been the drastic improvement in the company’s processing times. Snowflake’s optimized cloud infrastructure provides faster data processing and querying capabilities, significantly reducing time-to-insight.
- Access to Full Snowflake Feature Set: Moving to Snowflake has enabled the company to take advantage of features such as data sharing, enhanced security, and elasticity. Snowflake’s built-in scalability ensures our client’s data infrastructure will continue to grow effortlessly as its data needs expand.
- Speed and Cost Efficiency: The company has expressed particular satisfaction with both the speed and cost-efficiency of the Snowflake platform. The reduction in data processing time and cost per query has positively impacted its business operations.
Partnering with RiskSpan not only enabled the company to replace 1010data with a more modern and efficient platform, but it has also empowered them to take advantage of Snowflake’s newest, advanced features, including AI.
Contact us to learn how RiskSpan can help you unlock the full potential of your data by guiding you through complex transitions and helping you implement scalable, secure, and cost-effective solutions.
A leading fintech company specializing in home equity lines of credit (HELOCs), was seeking to optimize the management of its data operations. To accomplish this, the company turned to RiskSpan, a leader in data analytics and financial technology solutions. Through a tailored Data as a Service (DaaS) offering, RiskSpan helped the company improve its HELOC business operations by providing advanced data management and modeling capabilities.
Challenges
The company sought to enhance its HELOC operations in two critical areas:
- Data Management and Integration: The company was dealing with complex data sets from multiple sources, including credit bureaus, property data, and customer behavior insights. Integrating and managing this data effectively was crucial for making informed lending decisions.
- Risk Assessment and Modeling: Accurate and reliable risk assessment models were necessary for evaluating customer behavior and predicting loan performance. The company required a solution that could model draw behavior and other variables specific to HELOCs.
RiskSpan’s DaaS Solution
RiskSpan’s DaaS offering provided the company with a comprehensive solution tailored to address these challenges. The key components of the solution included:
- Advanced Data Integration: RiskSpan’s DaaS platform seamlessly integrated the company’s various data sources, enabling a more streamlined and efficient data management process. This integration allowed the company to better understand their borrowers and make more informed lending decisions.
- Enhanced Loan-Level HELOC Pricing and Projections: The client successfully loaded its historical loan performance data onto RiskSpan’s DaaS platform and established a monthly process within the platform’s flexible data warehouse. Using the embedded historical performance tool, the client analyzed loan-level behavior across its portfolio. This enabled the client to generate detailed collateral performance reports for investors and rating agencies, as well as leverage these insights to enhance future projections and loan-level pricing for new loans.
- Cost-Effective Data Services: RiskSpan also identified an opportunity to replace the client’s existing data services provider at a significantly reduced cost. By offering a more competitive pricing structure while maintaining high-quality data services, RiskSpan positioned the client to achieve substantial cost savings, making them more competitive in the HELOC market.
Outcomes and Benefits
Implementing RiskSpan’s DaaS solution brought several key benefits:
- Improved Decision-Making: With better-integrated data and more accurate modeling of HELOC draw behavior, the client could make more informed lending decisions, ultimately reducing risk and enhancing profitability.
- Operational Efficiency: The streamlined data management process allowed the client to operate more efficiently, freeing up resources to focus on core business activities.
- Cost Savings: RiskSpan’s competitive pricing enabled the client to cut costs significantly, improving their bottom line and allowing them to reinvest in other areas of the business.
RiskSpan’s Data as a Service solution provided the clients with the tools it needed to optimize its HELOC business. By addressing its data integration challenges, improving risk assessment through advanced modeling, and offering a cost-effective alternative to existing data services, RiskSpan helped the client strengthen its market position and enhance overall business performance.
Successfully forecasting MSR cash flows demands a level of precision and granularity in data analysis that few other asset classes require. This is especially true for investors seeking to estimate how much prepayment runoff they can reasonably expect to recapture, which is key to the performance of the asset. And often investors need to measure that performance by the specific pools of MSRs they purchase — as each pool may have its own unique recapture arrangements.
RiskSpan’s Edge Platform has incorporated a robust framework for managing MSR investment performance by enabling investors to track pool-specific performance and recapture analyses, thus obtaining a more nuanced understanding of their portfolios. In this post, we delve into some of the specific challenges MSRs pose, the benefits of transaction-specific segmentation, and the unique capabilities of RiskSpan’s Edge Platform.
Understanding Pool-Specific Performance
Owning MSRs requires investors to track the performance of various loan pools over time. For example, an investor may purchase an MSR pool and rely on a sub-servicer to service the loans as well as make efforts to recapture borrowers that are looking to refinance. It is important for the investor to understand and track the returns on that pool which may be largely driven by recapture efficiency.
While performance needs to be monitored on a pool-level, the modeling of the underlying loans is dependent on the distinct characteristics of the loans within a pool and will be more accurate if the models are run at the loan-level (or at granular rep lines determined by smart rep line logic). The ability to capture and analyze these pool-specific cash flows based on granular loan-level modeling is crucial for several reasons:
- Valuation Accuracy: Each loan can be valued more accurately by considering its unique attributes, such as the original loan terms, interest rates, and borrower profiles (e.g., FICO, LTV); at the same time, pools can be valued based on pool-specific assumptions such as recapture rates and prepayment penalties.
- Risk Management: Understanding the performance of individual pools helps in identifying which pools are more prone to prepayments or defaults, enabling more focused efforts on recapture and other risk management activities.
- Performance Tracking: Investors can track historical returns, CPRs, CDRs, Recapture and other historical performance metrics for each pool, facilitating more informed decision-making.
Supporting this functionality is RiskSpan’s ability to share and integrate data on Snowflake’s data cloud. RiskSpan’s Snowflake integration enhances the data management and analytics capabilities available to clients. Investors can easily share transaction-specific data through Snowflake, which is then seamlessly integrated into the Edge platform. The platform can then handle the large datasets (tens of millions of loans in some instances), providing real-time analytics and insights.
Recapture Analysis: Enhancing Portfolio Performance
Recapture analysis is a critical component for MSR portfolio risk management. When borrowers refinance or otherwise pay off their loans, the servicer’s cash flows usually vanish entirely. However, if, in the case of refinance, the investor retains the rights to service the loan replacing the refinanced loan, then the new loan can be considered as a recapture. RiskSpan’s Edge platform excels in tracking these recaptures, offering several advantages:
- Detailed Tracking: The platform allows for the separation and detailed tracking of original loans and their recaptures, maintaining the distinction between the two. Recaptures should have better performance (i.e., lower CPRs) than original loans.
- Performance Comparison: By comparing the performance of original loans and recaptures, investors can gauge the effectiveness of their recapture strategies.
- Granular Assumptions: Edge supports highly granular recapture rate assumptions used for projecting cash flows, which can be tailored to specific pools or deals, enhancing the precision of valuation.
A Case Study: Supporting a Large Mortage REIT’s MSR Portfolio Management Regime
A practical example of these capabilities involves a mortgage REIT, which relies on RiskSpan’s platform to manage a large MSR portfolio. Specifically, the Edge platform has enabled the REIT investor to accomplish the following:
- Capture Transaction-Specific Data: the investor can track and analyze data at the transaction level, maintaining detailed records of each pool’s performance and its recaptures. This allows, for example, investors to review performance with sub-servicers and evaluate whether certain changes can be made to enhance performance either on the existing pool or on future pools.
- Custom Assumption Setting: The platform allows for custom segmentation and assumption setting for valuation purposes, such as different recapture rates based on prepayment projections or loan age. This provides an ability to more accurately measure future projected cash flows and factor that into valuation of owned MSRs as well as potential purchases.
RiskSpan’s Edge platform offers MSR investors a robust toolset for managing their portfolios with precision not available anywhere else. By enabling pool-specific performance and detailed recapture analysis, Edge helps investors optimize their strategies and enhance portfolio performance. The ability to capture and analyze nuanced data points sets RiskSpan apart, making it a valuable ally in the complex landscape of MSR investments.
MSR investors, contact us to discover how tailored analytics and granular data management can transform your investment strategy and give you a competitive edge.
Background
Asset managers are increasingly turning to Snowflake’s cloud infrastructure to address the limitations of outdated databases. Migrating to Snowflake grants them access to a sustainable and secure platform that enables efficient data storage, processing, and analytics. This transition empowers asset managers to streamline operations, improve data accessibility, and reduce costs associated with maintaining on-premises infrastructure.
Client Challenge
A large insurance company’s asset management team was seeking to improve its approach to data management in response to its increasingly complex investment portfolio. The company recognized that transitioning to Snowflake would serve as a foundation for sustainable data analysis for years to come.
Desiring a partner to assist with the transition, the life insurer turned to RiskSpan – a preferred Snowflake partner with substantial experience in database architecture and management.
Specifically, the insurance company sought to achieve the following:
Systems Consolidation: Data stored across multiple transactional systems had contributed to data fragmentation and inefficiencies in data retrieval and analysis. The client sought to establish and maintain a consistent source of asset data for enterprise consumption and reporting.
Improved Reporting Capabilities: Quantifying full risk exposures in fast-moving situations proved challenging, leaving the institution vulnerable to unforeseen market fluctuations. Consequently, the client sought to improve its asset evaluation and risk assessment process by incorporating comprehensive look-through data and classification information. The need for various hierarchical classifications further complicated data access and reporting processes which required streamlining the process of producing ad-hoc exposure reports, which often required several weeks and involved teams of people.
Reduction of Manual Processes: The client needed more automated data extraction processes in order to create exposure reports across different asset classes in a more time-efficient manner with less risk of human error.
Reduction of Infrastructure Constraints: On-premise infrastructure had defined capacity limitations, hindering scalability and agility in data processing and analysis.
RiskSpan’s Approach and Solutions Implemented
Collaborative Partnership: RiskSpan worked closely with the client’s IT, risk management, and analytics teams throughout the project lifecycle, fostering collaboration and ensuring alignment with organizational goals and objectives.
Comprehensive Assessment: Together, we conducted a thorough assessment of the client’s existing data infrastructure, analytics capabilities, and business requirements to identify pain points and opportunities for improvement.
Strategic Planning: Based on the assessment findings, the collective team developed a strategic roadmap outlining the migration plan to the unified data platform, encompassing asset data consolidation, portfolio analytics enhancement, and reporting automation.
Unified Data Platform: Leveraging modern technologies, including cloud-based solutions and advanced analytics tools, RiskSpan orchestrated the integration of various data sources and analytics capabilities. Together, we consolidated asset data from various transactional systems into a unified data platform, providing a single source of truth for comprehensive asset evaluation and risk assessment.
Data Lineage Tracking: The team employed dbt Labs tools to build, validate, and deploy flexible reporting solutions from the Snowflake cloud infrastructure. This enabled the tracking of data lineage, adjustments, and ownership.
Daily Exposure Reporting: Leveraging automated analytic pipelines, we enabled real-time generation of exposure reports across different asset classes, enhancing the client’s ability to make timely and informed decisions.
Automated Data Extraction: We automated the data extraction processes, reducing manual intervention and streamlining data retrieval, cleansing, and transformation workflows.
Hierarchical Classification Framework: We implemented a hierarchical classification framework, providing standardized and consistent data hierarchies for improved data access and reporting capabilities.
Transformative Outcomes
Enhanced Decision-making: Implementing advanced analytics capabilities and exposure reporting empowered our client to make informed decisions more quickly, mitigating risks and capitalizing on market opportunities.
Operational Efficiency: Automation of data extraction, analytics modeling, and reporting processes resulted in significant operational efficiencies, reducing time-to-insight and enabling resource reallocation to strategic initiatives.
Scalability and Agility: The migration to a cloud-based infrastructure provides scalability and agility, allowing our client to adapt quickly to changing business needs and accommodate future growth without infrastructure constraints.
Data Governance and Compliance: The implementation of standardized hierarchical classifications strengthened data governance and compliance, ensuring data consistency, integrity, and regulatory adherence. By leveraging Snowflake’s scalable architecture and advanced features, this large asset manager is now positioned to maneuver both its current and future data landscapes. The implementation of Snowflake not only streamlined data management processes but also empowered the organization to extract valuable insights with unprecedented efficiency. As a result, the asset manager can make data-driven decisions confidently, enhance operational agility, and drive sustainable growth in a rapidly evolving market landscape.
The Situation
One of the largest financial institutions in the world, operating in a highly competitive and regulated environment, found itself under increasing scrutiny over the fragmented state of its model performance tracking regime.
Failing to meet both internal standards and external regulatory expectations, the the institution’s model performance tracking relied on a loan-level analytical framework that overloaded its legacy systems and hindered its ability to react to changing market dynamics. These inadequacies led to significant challenges beyond regulatory scrutiny, including inefficiencies in risk management processes and higher overhead costs. The outlook for rectifying these shortcomings was murky.
The Challenge
The institution’s challenges were twofold.
First, regulatory pressure was mounting, with potential repercussions including fines and restrictions on business activities. Regulators demanded transparent, accurate, and timely reporting of model performance, which the institution’s existing system could not provide.
Second, the operational issues stemming from lackluster model performance tracking were beginning to affect the institution’s ability to capitalize on opportunities. These impacts included inaccurate risk assessments, suboptimal asset allocation, and impaired decision-making capabilities, all of which eroded the institution’s competitive edge.
The Solution
The institution sought RiskSpan’s expertise to deliver a sustainable and effective MPT framework. The trust the institution placed in RiskSpan was grounded in RiskSpan’s history of helping other financial institutions navigate similar MPT shortcomings.
RiskSpan conducted an in-depth gap analysis, developed a customized solution, and provided training and support. Designed to enhance the accuracy, efficiency, and transparency of model performance tracking, the solution incorporated advanced analytics, a holistic governance approach, and robust data management practices. Key components included:
Model Inventory Management: Creating a centralized repository for all models, including inputs, assumptions, and ownership to streamline tracking and compliance.
Model Performance Dashboard: Implementing a real-time monitoring dashboard that provides insights into each model’s performance, deviations from expected outcomes, and potential areas of concern.
Regulatory Compliance: Automating the generation of reports to ensure compliance with regulatory standards, reducing manual errors, and freeing up resources for other critical functions.
Training and Support: Providing comprehensive training to the institution’s staff to ensure they can effectively utilize the new system and offering ongoing support to address any issues promptly.
The partnership led to transformative outcomes, including improved risk management, reduced manual errors, and operational costs.
What this means for you (and your bank)
Precise model performance tracking can enhance risk management, regulatory compliance, and operational efficiency. Our expertise ensures that our clients are equipped with robust, cutting-edge solutions tailored to their specific needs. If you are encountering challenges, we encourage you to reach out to us for a consultation.
The Client
Government Sponsored Enterprise (GSE)
The Problem
The client sought to transition its ERCF spot capital reporting process from legacy systems and processes to a new, fully integrated system with automated processes.
This required the re-creation and automation in Snowflake of a legacy report for FHFA consisting of 30 credit risk and risk factor grids rolled up from the loan level.
The Solution
RiskSpan led a cross-functional effort including the data and reporting teams to implement a fully automated report using data and SQL in Snowflake.
The Deliverables
- Loan attributes re-mapped from legacy data to Snowflake data
- Reverse-engineered logic mapping attribute values to grid cohorts
- Complex and efficient SQL developed in Snowflake to transform loan-level spot capital data into cohorts for credit risk grids
- Conversion of 13 million loan records into more than 2,200 grid cells in less than 3 minutes
- Design and execution UAT in cooperation with the business team
- Fully automated FHFA credit risk report populated by calling SQL