Models & Markets Update: May 2026
Register here for next month’s call: Thursday, June 18th 2026, 1 p.m. ET.
Key Takeaways
- Prepayment models continue to perform well; April discount coupon speeds remain stable, driven primarily by housing turnover
- Premium coupon speeds fell sharply in May factor data as the March mortgage rate sell-off reduced refinancing incentive and flattened the S-curve
- GNMA premium coupons showed a moderate speed decline but proved more resilient than conventional counterparts
- Non-QM Credit Model CM 7.1 enters beta testing in June and is targeted for production release around July 10th; a dedicated webinar is planned for the second half of June
- No Federal Reserve rate cuts are expected in 2026; CME FedWatch now shows a meaningful probability of a rate hike later this year or in early 2027
- Mortgage rates have climbed back to levels last seen in summer 2025, with the Freddie Mac survey rate at 6.51% and Mortgage News Daily at 6.65%
- The 10-year Treasury rose approximately 50 basis points since February; market consensus expects it to reach ~4.8% by year-end and remain above 4% for the next 2–3 years
- CPI inflation rose to 3.8% year-over-year in April; core CPI at 2.8% — both well above the Fed’s 2% target
- Home prices stagnating nationally (~0.67% YoY per Case-Shiller); San Francisco has turned negative while New York continues to grow at ~4.8%
- Consumer stress deepens: low- and middle-income households carry credit card debt roughly 3x their monthly spending at ~23% APR; buy now, pay later obligations add further hidden risk not captured in credit bureau data
You can read the recap below or click here for the entire recording.
Prepayment Model Back-Testing: May Factor Data Update
The prepayment model continues to track realized speeds closely across Agency collateral. Results are available on the Edge platform under the Vertex module.
Fannie/Freddie — Discount Coupons (WAC 5.5 and Below)
April speeds for Fannie/Freddie discount coupons remained relatively stable. Because these lower-coupon loans carry little to no refinancing incentive, prepayment activity is driven almost entirely by housing turnover, which has held steady.

Figure 1: FN/FH Discount Coupon Back-Testing — Model CPR vs. Observed CPR
Fannie/Freddie — Premium Coupons (WAC 6.0 and Higher)
Premium coupon speeds fell sharply in the May factor data, reflecting the March mortgage rate sell-off. Rising rates reduced refinancing incentive and caused a notable flattening of the S-curve. The May S-curve sits meaningfully below both the April curve and the long-run historical average (January 2014–May 2026), with the gap widening at higher incentive levels. A diminishing media effect in the May cohort contributed to the flatter shape.

Figure 2: FN/FH Premium Coupon Back-Testing — Model CPR vs. Observed CPR

Figure 3: EDGE Historical Performance — FN/FH S-Curve (Refi Incentive vs. CPR)
GNMA — Discount and Premium Coupons
GNMA collateral showed a similar pattern. Discount coupon speeds remained supported by turnover activity, while premium coupon speeds saw a moderate decline consistent with the higher-rate environment. Notably, GNMA premiums proved more resilient than their conventional counterparts when compared against the conventional S-curve, reflecting structural differences in the GNMA borrower population.

Figure 4: GN/G2 Discount and Premium Coupon Back-Testing — Model CPR vs. Observed CPR
Non-QM Credit Model: CM 7.1 Update
CM 7.1, RiskSpan’s new Non-QM Credit Model, is on track to enter beta testing in June with a targeted production release around July 10, 2026. A detailed webinar covering the model will be held in the second half of June.
Model Structure
CM 7.1 uses the same three-stage architecture as RiskSpan’s agency credit model:
- Transition Models (four, one per documentation type) — each independently estimated
- Bank Statement
- DSCR
- Full Doc
- Other
- Liquidation Timeline Model — applied once a loan enters default
- Severity Model — estimates final losses on the defaulted balance
Each documentation type is modeled independently at the transition stage, then fed into a unified liquidation timeline and severity model. This segmentation reflects meaningfully different performance characteristics across Non-QM documentation types.

Figure 5: CM 7.1 Model Structure — Four Transition Models Feed into Unified Liquidation and Severity Models
Macroeconomic Update: May 2026
Federal Reserve — No Rate Cuts Expected; Hike Risk Emerging
The Fed funds rate remains at 350–375 bps. CME FedWatch futures indicate it is highly unlikely to be cut in 2026. More notably, the conditional probabilities have shifted over the past 4–6 weeks to reflect a meaningful likelihood of a rate hike in the latter part of 2026 or early 2027. With persistent inflation and a new Fed chair, the market sees little room for easing.

Figure 6: Federal Funds Target Range — Upper Limit (Source: FRED) and CME FedWatch Conditional Probabilities
Treasury Yield Curve — Significantly Higher Than February
The Treasury yield curve has shifted materially upward since the February 2026 trough, when the 10-year yield was at its lowest recent level and mortgage rates briefly approached 6%. Since then:
- The 10-year and 30-year Treasuries rose approximately 50 basis points
- The 2-year Treasury rose approximately 75–80 basis points
- As of May 21, the 10-year Treasury stood at approximately 4.60%
This move is attributed to geopolitical dynamics (including the situation around Iran) and a declining global appetite for U.S. Treasuries, with recent auctions clearing at progressively higher yields. Market consensus projects the 10-year to reach approximately 4.8% by December 2026 and to remain above 4% for the next 2–3 years.

Figure 7: Treasury Yield Curves — January through May 2026
Mortgage Rates — Back to Summer 2025 Levels
Mortgage rates have given back much of the progress made earlier in the year. As of the call date, the Freddie Mac primary survey rate was 6.51% and the Mortgage News Daily rate was 6.65% — levels last seen in August 2025. The expectation is that mortgage rates will remain at or above 6.25% for the foreseeable future, with a sub-6% rate considered unlikely in the near term.

Figure 8: 10-Year Treasury Yield Forecast and Primary Mortgage Rate Trend (Mortgage News Daily, MBA, Freddie Mac)
Inflation — Staying Elevated
The April 2026 CPI print came in at 3.8% year-over-year; core CPI (excluding food and energy) ran at 2.8%, well above the Fed’s 2% target. The PCE index was not yet published at call time but was expected to confirm continued inflationary pressure. Combined with stable unemployment, this leaves the Fed with limited flexibility to ease.
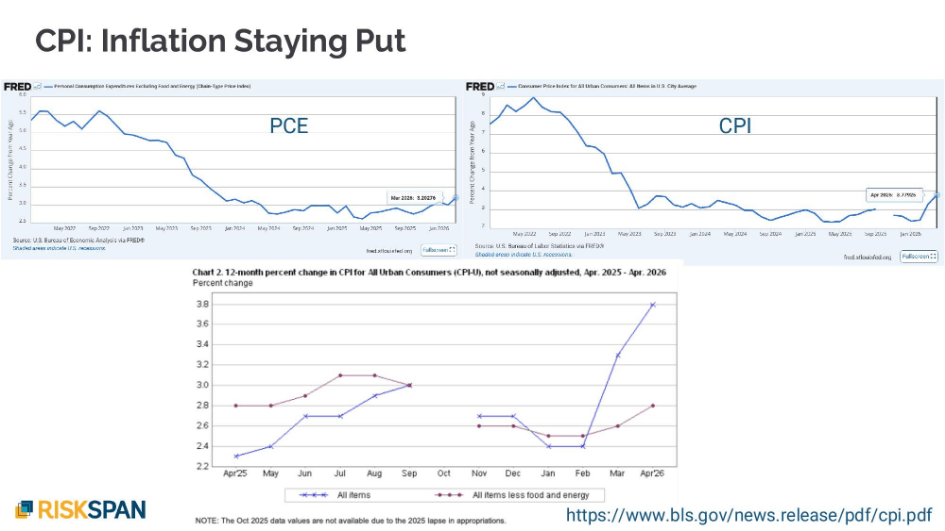
Figure 9: PCE Inflation (ex. Food & Energy) and CPI — Year-over-Year % Change
Home Prices — Stagnating, with Pronounced Regional Variation
National home price growth has slowed to near-zero. The Case-Shiller National Index showed approximately +0.67% year-over-year as of February 2026, while the 10-City Composite came in at +1.74%, suggesting urban markets are modestly outperforming. Regional divergence is pronounced: San Francisco has recorded negative price growth for approximately the past six months (-0.34% YoY), while New York remains solidly positive at +4.78%.
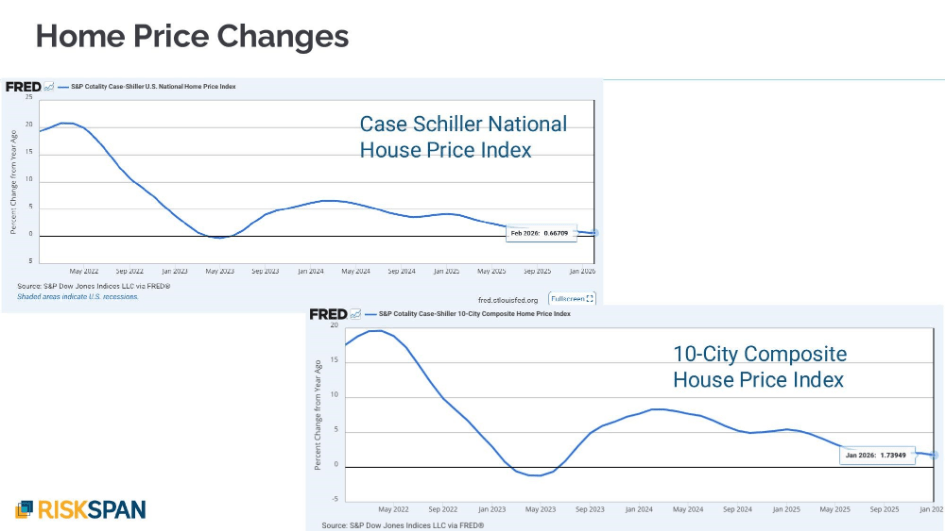
Figure 10: Case-Shiller National and 10-City Composite Home Price Indices — Year-over-Year % Change

Figure 11: Case-Shiller San Francisco and New York Home Price Indices — Year-over-Year % Change
Consumer Stress: Evidence from Credit Card Spending
This month’s call featured a deep dive into consumer financial stress, drawing on research from the Federal Reserve Bank of Boston. The analysis is particularly relevant to mortgage credit risk given evidence of rising delinquencies in FHA and Non-QM collateral.
Credit Landscape
Agency loans (excluding FHA) continue to show low delinquency rates with no significant deterioration. FHA, however, is exhibiting elevated delinquencies that remain high even after accounting for the trial modification policy introduced in October 2025, which holds more loans in delinquent states during the modification process. The Non-QM universe has also begun to show a rising delinquency trend over the past 12–18 months.
Boston Fed Analysis: Spending and Debt by Income Group
A study from the Federal Reserve Bank of Boston segments credit card behavior across three income cohorts and reveals a striking disparity between spending levels and outstanding balances:
- Low-income ($0–$39K): monthly spending ~$25B vs. revolving debt ~$80B — a 3x ratio; this group is primarily revolving rather than paying off balances
- Middle-income ($59K–$83K): spending ~$37B vs. debt ~$105B — also approximately a 3x ratio
- High-income ($121K+): spending ~$170B vs. debt ~$185B — roughly 1:1, consistent with transactor behavior (spend and pay off monthly)
Low- and middle-income households are therefore carrying roughly three months’ worth of spending as permanent revolving debt, at credit card APRs recently running around 23% on new issuances. Total credit card outstanding nationally has reached approximately $1.25 trillion.

Figure 12: Aggregate Credit Card Spending by Income Group, January 2015–May 2025 (Source: Boston Fed / Federal Reserve Y-14M)

Figure 13: Aggregate Credit Card Debt by Income Group, January 2015–April 2025 (Source: Boston Fed / Federal Reserve Y-14M)
Buy Now, Pay Later: An Untracked Risk
Buy now, pay later (BNPL) services have grown rapidly and appear to be used disproportionately by lower-income households. Because BNPL obligations are not reported to credit bureaus, they represent an invisible liability not reflected in standard debt figures. The team flagged this as a developing risk to monitor, particularly for its potential impact on borrower liquidity and mortgage performance in the FHA universe.
Summary
| Topic | Key Takeaway |
| Prepayment Model | Performing well overall; April discount speeds stable (turnover-driven); May premium speeds fell sharply on March rate sell-off and S-curve flattening |
| GNMA Performance | Discount speeds supported by turnover; premium speeds declined moderately but more resilient than conventional counterparts |
| Non-QM Credit Model | CM 7.1 beta in June; production release ~July 10; dedicated webinar in second half of June |
| Mortgage Rates | Freddie Mac at 6.51%; Mortgage News Daily at 6.65%; back to summer 2025 levels; sub-6.25% rate unlikely near-term |
| Fed Policy | No cuts expected in 2026; CME FedWatch shows meaningful probability of hike later in 2026 or early 2027 |
| Treasury Yields | 10-year up ~50 bps since February; 2-year up ~75–80 bps; consensus at ~4.82% by year-end |
| Inflation | CPI 3.8% YoY (April); core CPI 2.8%; PCE similarly elevated; well above 2% target |
| Home Prices | National ~+0.67% YoY; San Francisco negative; New York +4.78%; highly geography-dependent |
| Consumer Stress | Low/mid-income households revolving 3x monthly spending at ~23% APR; BNPL obligations add hidden risk; FHA and Non-QM delinquencies trending higher |
We continue to add additional analytics reports on the RiskSpan Platform. Please visit www.riskspan.com/request-access to request free access.
As always, please feel free to contact us to discuss or learn more.