Register here for next month’s call: Thursday, August 20th, 2026, 1 p.m. ET.
Key Takeaways
- Prepayment models remain reliable, but the fast bias showing up in in-the-money cohorts is worth watching if rates keep climbing and more loans move into the money
- Non-QM credit risk is becoming a bigger focus right as CM 7.1 goes live — the model is arriving just as delinquency trends turn less benign
- The market has flipped from pricing rate cuts to pricing a hike this year — a real shift in the rate outlook, not noise
- Elevated rates and mortgage costs look like a multi-year reality rather than a temporary plateau, with labor data adding a note of underlying softness beneath a falling headline unemployment rate
This month’s call covered prepayment model back-testing, a deep dive on conventional model performance, the growing Non-QM universe, the production release of RiskSpan’s Non-QM Credit Model (CM 7.1), and the latest macro picture.
You can read the recap below or click here for the entire recording.
Prepayment Model Back-Testing
The prepayment model continues to closely track realized speeds across Fannie, Freddie, and Ginnie collateral. Discount coupons (WAC 5.5 and below) remain structurally low and range-bound at roughly 4–8 CPR, consistent with these loans sitting out of the money in a turnover-driven regime. Premium coupons (WAC 6 and above) eased slightly in June, as a 13 bp increase in the driving mortgage rate outweighed a 5% rise in day count — visible in a modest month-over-month flattening of the conventional S-curve. FHA/VA aging-ramp peaks have also come down from prior levels, with VA loans continuing to ramp faster and higher than FHA.
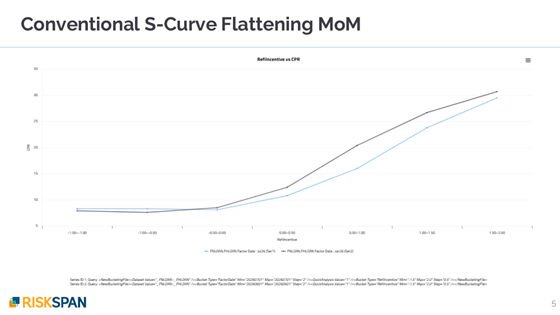
Conventional S-Curve Flattening MoM
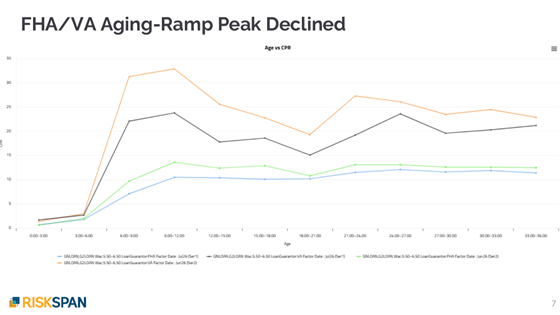
FHA/VA Aging-Ramp Peak Declined
Conventional Deep Dive
A closer look at FH30 and FN30 performance found the model running fast versus actuals in June — a bias of roughly 1 CPR — with month-over-month direction captured well but magnitude off: the model overreacts in out-of-the-money cohorts and underreacts in in-the-money cohorts, where its error is markedly larger (~2 CPR vs. ~0.8 CPR).
Curtailment and buyout activity move in opposite directions over a loan’s life. Curtailments are front-loaded, peaking in the newest vintages and fading with age, while buyouts build slowly and grow as loans season and credit stress accumulates. The effect is large: comparing 2023 to 2025 vintages in higher-coupon cohorts, Freddie Mac loans show roughly 7x the buyout activity, and Fannie Mae loans show roughly 3x.
Non-QM Universe and Credit Model 7.1
Non-QM issuance is tracking toward roughly $100B for 2026 — Q2 came in around $27B, down 16% quarter-over-quarter but up 58% year-over-year — with originations running at about $170–180B. Delinquency data gave a mildly encouraging signal, with the 2023 vintage appearing to plateau around 24 months of loan age, though risk stays concentrated in bank-statement and self-employed borrowers and lower FICO bands. Zooming out, delinquency has been climbing across consumer credit broadly (subprime auto, personal loans, mortgage, Non-QM) since 2021.
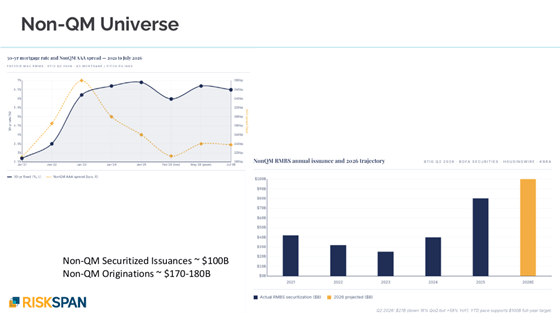
Non-QM RMBS Issuance and 2026 Trajectory
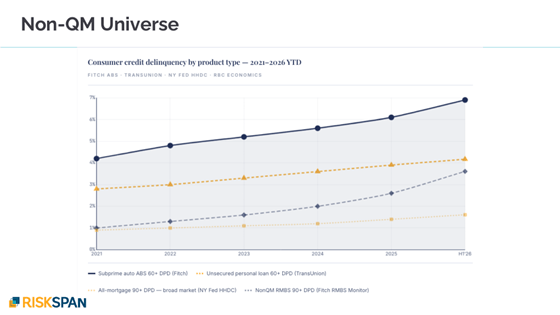
Consumer Credit Delinquency by Product Type
Against that backdrop, RiskSpan’s Non-QM Credit Model — CM 7.1 — has moved into production and is now available to all clients. It runs four independent transition models by documentation type (Bank Statement, DSCR, Full Doc, Other), feeding into a single liquidation-timeline and severity model recalibrated to current Non-QM performance.
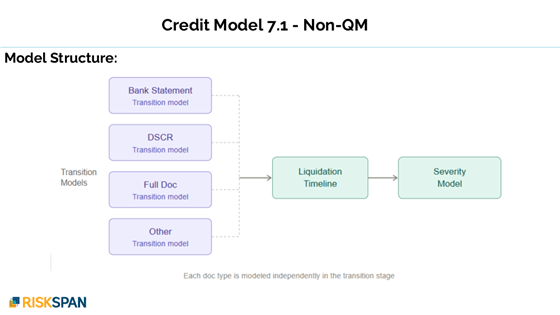
CM 7.1 Model Structure
Macroeconomic Update
The biggest change this month is at the Fed. A couple of months ago the market was pricing in up to two rate cuts this year; CME FedWatch data now show meaningful odds of a hike instead, with the Fed funds rate seen moving from 350–375 bps toward 375–400 bps by year-end.
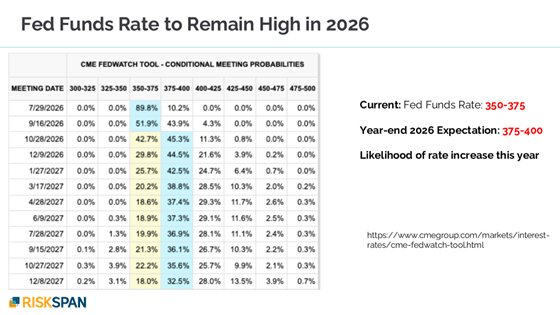
Fed Funds Rate to Remain High in 2026
Longer rates have followed suit. The 10-year Treasury, just above 4.5%, is expected to climb another 20–25 bps toward ~4.9% before easing — but to hold above 4% for a couple of years. Mortgage rates, currently around 6.5–6.6%, are expected to reach as high as ~6.9% by spring 2027 and stay above 6.5% for the next two to three years.
The labor market sent a mixed signal. June payrolls rose just 57K, roughly half of what was expected, and April/May were revised down a combined 75,000 jobs — pointing to real underlying softness. Headline unemployment actually ticked down to 4.2%, but that came from falling labor force participation (61.5%, the lowest since 2021) rather than hiring; the household survey showed 507,000 fewer people employed. On a brighter note, CPI eased to 3.5% year-over-year and wage growth matched it exactly — the first time in 12–18 months that real wage growth hasn’t been negative.
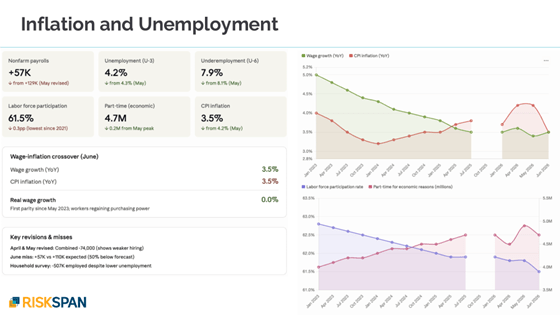
Inflation and Unemployment

We continue to add additional analytics reports on the RiskSpan Platform. Please visit www.riskspan.com to request access.
As always, please feel free to contact us to discuss or learn more.
Register here for next month’s call: Thursday, July 16th 2026, 1 p.m. ET.
Key Takeaways
- Prepayment model continues to perform well; discount coupon speeds (WAC 5.5 and below) remain stable across Fannie/Freddie and GNMA, driven by housing turnover
- Premium coupon speeds (WAC 6.0+) declined as elevated rates reduced refi incentive; UPB rising steeply on new gross issuance of low-seasoning loans
- FN/FH S-curve has flattened materially from April to June; GNMA saw similar compression but at tighter intervals and with less magnitude
- Non-QM prepay speeds declined across all doc types in May remits; Non-QM DQ60+ rates ticked down marginally
- Non-QM Credit Model CM 7.1 in beta; available July 15; dedicated webinar coming before release
- Fed held rates at June 17–18 meeting; year-end expectation shifted to 375–400 bps; meaningful probability of a hike as early as September; dot plot revised to 3.8% for 2026
- Mortgage rates near 6.5%, back to summer 2025 levels; 6% viewed as 2026 floor; 10-yr TSY expected above 4% for years
- CPI at 3.8% YoY, real wage growth -0.4% (first negative since 2022); U-6 underemployment at 8.1%
- Home prices near-flat nationally (+0.67% YoY); inventory-constrained, not demand-driven; significant geographic divergence
You can read the recap below or click here for the entire recording.
Prepayment Model Back-Testing: June Factor Data Update
The prepayment model continues to track realized speeds closely across Agency collateral (results available in Edge under Vertex). The June factor data captures May remittances.
Fannie/Freddie — Discount Coupons (WAC 5.5 and Below)
Model CPR closely tracks observed CPR, confirming the model is well-calibrated in the turnover regime. With minimal refi incentive at current rate levels, prepayment activity is driven almost entirely by housing turnover, which has held steady.

Figure 1: FN/FH Discount Coupon Back-Testing — Model CPR vs. Observed CPR
Fannie/Freddie — Premium Coupons (WAC 6.0 and Higher) and S-Curve
Premium speeds declined due to elevated mortgage rates and fewer day counts in May vs. April. UPB is also rising steeply, reflecting gross issuance of newly originated loans with limited seasoning that further dampens prepay. The S-curve flattening tells the fuller story: comparing April, May, and June factor months, the curve has collapsed from the April peak (green), with borrowers responding progressively less to the same level of refi incentive.

Figure 2: FN/FH Premium Coupon Back-Testing — Model CPR vs. Observed CPR

Figure 3: FN/FH S-Curve Flattening — April, May, and June Factor Months
GNMA — Discount and Premium Coupons
GNMA discount speeds remain supported by turnover. Premium speeds are declining but proved more resilient than conventional — approximately 14% reduction vs. 24% for Fannie/Freddie. The GNMA S-curve is compressing, but at tighter intervals than the more pronounced slope collapse seen in conventional.

Figure 4: GN/G2 Discount and Premium Coupon Back-Testing — Model CPR vs. Observed CPR
Non-QM Historical Performance
Based on Cotality data through the Edge platform’s historical performance module, capturing the June factor date (May remittances).
Prepayment Speeds
Speeds declined across all three major doc types reflecting the rate environment: bank statement 29→22 CPR, DSCR 21→16 CPR, full doc 17→16 CPR. Full doc loans carry a lower WAC (~5.1% vs. 6.9–7.1% for bank statement and DSCR) and are more locked in, though they show a steeper S-curve response when refi incentive is held constant. Many DSCR loans remain within prepayment penalty terms, though 2023 originations with three-year terms are now beginning to exit that window, which could lift speeds going forward.

Figure 5: Non-QM CPR by Documentation Type (July 2023–June 2026)
Delinquencies
DQ60+ rates ticked down marginally in May remits: bank statement ~4%, DSCR ~3%, full doc ~0.72%. A wide gap persists across doc types even after controlling for FICO and LTV. The 2023 vintage remains the highest-delinquency cohort, driven by somewhat looser underwriting and a credit burnout effect — stronger borrowers in that high-WAC vintage have already paid down or refinanced, leaving a residual pool more likely to be credit-impaired.

Figure 6: Non-QM DQ60+ by Documentation Type (July 2023–June 2026)

Figure 7: Non-QM DQ60+ by Vintage and Loan Age
Non-QM Credit Model: CM 7.1 Update
CM 7.1 is in beta testing and will be generally available on July 15, 2026. A dedicated webinar is planned before the production release. The model uses a three-stage architecture with four independently estimated transition models (Bank Statement, DSCR, Full Doc, Other) feeding a unified liquidation timeline and severity model — capturing the meaningfully different performance characteristics across Non-QM documentation types seen in the historical data above.

Figure 8: CM 7.1 Model Structure
Macroeconomic Update: June 2026
Federal Reserve — On Hold, With a Hike Now on the Table
The Fed held rates at its June 17–18 meeting (350–375 bps). The big shift is in forward expectations: comparing CME FedWatch probabilities from May 20 to June 17, the likelihood of a rate hike has risen materially, with a meaningful probability of an increase as early as September. Year-end 2026 market expectation has shifted from 350–375 to 375–400 bps. The Fed’s own June dot plot revised the 2026 median funds rate to 3.8%, up from 3.4% in March, as inflation surprised to the upside and strong payrolls data reduce pressure to ease.

Figure 9: CME FedWatch Conditional Probabilities (May 20 vs. June 17) and Fed Dot Plot
Rates, Inflation, and Home Prices
Treasury and mortgage rates: The 10-year TSY consensus forecast peaks near 4.6% by year-end 2026 and stays above 4% for the next several years. Mortgage rates have been notably volatile since late February, climbing from ~6% back to ~6.5% as of mid-June. The team views 6% as the effective 2026 floor.
Inflation and labor: CPI at 3.8% YoY vs. wage growth of 3.4% produces real wage growth of -0.4% — the first negative year since 2022. U-3 unemployment is 4.3%; U-6 underemployment is 8.1%. Labor force participation is at its lowest since 2021. May payrolls came in at 172K vs. 80K expected but gains were concentrated in leisure/hospitality and local government. The Fed’s June projections raised 2026 PCE inflation to 3.6% (from 2.7% in March).
Home prices: Case-Shiller National at +0.67% YoY (March 2026); 20-City Composite at +0.83%. Gains appear to be inventory-constrained rather than demand-driven. Geographic divergence is significant — some MSAs are in negative territory, which is a relevant risk factor for Non-QM collateral concentration.

Figure 10: 10-Year Treasury Consensus Forecast and Mortgage Rate Trend

Figure 11: Inflation, Wage Growth, and Labor Market Dashboard

Figure 12: Case-Shiller National and 20-City Composite Home Price Indices
Summary
| Topic | Key Takeaway |
| Prepayment Model | Performing well; discount speeds stable (turnover-driven); premium speeds declined on elevated rates and fewer May day counts; UPB rising steeply on new gross issuance |
| FN/FH S-Curve | Materially flatter from April to June; borrowers responding less to refi incentive; newer vintages pulling down aggregate |
| GNMA Performance | Discount speeds stable; premium speeds down but more resilient than conventional (14% reduction vs. 24% for FN/FH); S-curve compression at tighter intervals |
| Non-QM Prepay | Bank statement 29→22 CPR; DSCR 21→16 CPR; Full doc 17→16 CPR; rate-driven; DSCR partly shielded by prepay penalty terms |
| Non-QM DQ | DQ60+ ticked down marginally: bank statement ~4%, DSCR ~3%, full doc ~0.72%; 2023 vintage remains highest-DQ cohort (loose underwriting + credit burnout) |
| CM 7.1 Credit Model | Beta testing now; available July 15; dedicated webinar before release; four doc-type transition models feeding unified liquidation and severity model |
| Fed Policy | Held at 350–375 bps (June 17–18 meeting); year-end expectation shifted to 375–400; hike possible as early as September; dot plot revised to 3.8% median for 2026 vs. 3.4% in March |
| Rates | 10-yr TSY consensus peaks ~4.6% year-end, stays above 4% for years; mortgage rates ~6.5%, back to summer 2025 levels; 6% viewed as 2026 floor |
| Inflation & Labor | CPI 3.8% YoY; wage growth 3.4%; real wages -0.4% (first negative since 2022); U-3 4.3%, U-6 8.1%; May payrolls 172K vs. 80K expected |
| Home Prices | Case-Shiller National +0.67% YoY (March 2026); gains inventory-driven, not demand-driven; significant geographic variation with some MSAs negative |
We continue to add additional analytics reports on the RiskSpan Platform. Please visit www.riskspan.com/request-access to request free access.
As always, please feel free to contact us to discuss or learn more.
Register here for next month’s call: Thursday, June 18th 2026, 1 p.m. ET.
Key Takeaways
- Prepayment models continue to perform well; April discount coupon speeds remain stable, driven primarily by housing turnover
- Premium coupon speeds fell sharply in May factor data as the March mortgage rate sell-off reduced refinancing incentive and flattened the S-curve
- GNMA premium coupons showed a moderate speed decline but proved more resilient than conventional counterparts
- Non-QM Credit Model CM 7.1 enters beta testing in June and is targeted for production release around July 10th; a dedicated webinar is planned for the second half of June
- No Federal Reserve rate cuts are expected in 2026; CME FedWatch now shows a meaningful probability of a rate hike later this year or in early 2027
- Mortgage rates have climbed back to levels last seen in summer 2025, with the Freddie Mac survey rate at 6.51% and Mortgage News Daily at 6.65%
- The 10-year Treasury rose approximately 50 basis points since February; market consensus expects it to reach ~4.8% by year-end and remain above 4% for the next 2–3 years
- CPI inflation rose to 3.8% year-over-year in April; core CPI at 2.8% — both well above the Fed’s 2% target
- Home prices stagnating nationally (~0.67% YoY per Case-Shiller); San Francisco has turned negative while New York continues to grow at ~4.8%
- Consumer stress deepens: low- and middle-income households carry credit card debt roughly 3x their monthly spending at ~23% APR; buy now, pay later obligations add further hidden risk not captured in credit bureau data
You can read the recap below or click here for the entire recording.
Prepayment Model Back-Testing: May Factor Data Update
The prepayment model continues to track realized speeds closely across Agency collateral. Results are available on the Edge platform under the Vertex module.
Fannie/Freddie — Discount Coupons (WAC 5.5 and Below)
April speeds for Fannie/Freddie discount coupons remained relatively stable. Because these lower-coupon loans carry little to no refinancing incentive, prepayment activity is driven almost entirely by housing turnover, which has held steady.

Figure 1: FN/FH Discount Coupon Back-Testing — Model CPR vs. Observed CPR
Fannie/Freddie — Premium Coupons (WAC 6.0 and Higher)
Premium coupon speeds fell sharply in the May factor data, reflecting the March mortgage rate sell-off. Rising rates reduced refinancing incentive and caused a notable flattening of the S-curve. The May S-curve sits meaningfully below both the April curve and the long-run historical average (January 2014–May 2026), with the gap widening at higher incentive levels. A diminishing media effect in the May cohort contributed to the flatter shape.

Figure 2: FN/FH Premium Coupon Back-Testing — Model CPR vs. Observed CPR

Figure 3: EDGE Historical Performance — FN/FH S-Curve (Refi Incentive vs. CPR)
GNMA — Discount and Premium Coupons
GNMA collateral showed a similar pattern. Discount coupon speeds remained supported by turnover activity, while premium coupon speeds saw a moderate decline consistent with the higher-rate environment. Notably, GNMA premiums proved more resilient than their conventional counterparts when compared against the conventional S-curve, reflecting structural differences in the GNMA borrower population.

Figure 4: GN/G2 Discount and Premium Coupon Back-Testing — Model CPR vs. Observed CPR
Non-QM Credit Model: CM 7.1 Update
CM 7.1, RiskSpan’s new Non-QM Credit Model, is on track to enter beta testing in June with a targeted production release around July 10, 2026. A detailed webinar covering the model will be held in the second half of June.
Model Structure
CM 7.1 uses the same three-stage architecture as RiskSpan’s agency credit model:
- Transition Models (four, one per documentation type) — each independently estimated
- Bank Statement
- DSCR
- Full Doc
- Other
- Liquidation Timeline Model — applied once a loan enters default
- Severity Model — estimates final losses on the defaulted balance
Each documentation type is modeled independently at the transition stage, then fed into a unified liquidation timeline and severity model. This segmentation reflects meaningfully different performance characteristics across Non-QM documentation types.

Figure 5: CM 7.1 Model Structure — Four Transition Models Feed into Unified Liquidation and Severity Models
Macroeconomic Update: May 2026
Federal Reserve — No Rate Cuts Expected; Hike Risk Emerging
The Fed funds rate remains at 350–375 bps. CME FedWatch futures indicate it is highly unlikely to be cut in 2026. More notably, the conditional probabilities have shifted over the past 4–6 weeks to reflect a meaningful likelihood of a rate hike in the latter part of 2026 or early 2027. With persistent inflation and a new Fed chair, the market sees little room for easing.

Figure 6: Federal Funds Target Range — Upper Limit (Source: FRED) and CME FedWatch Conditional Probabilities
Treasury Yield Curve — Significantly Higher Than February
The Treasury yield curve has shifted materially upward since the February 2026 trough, when the 10-year yield was at its lowest recent level and mortgage rates briefly approached 6%. Since then:
- The 10-year and 30-year Treasuries rose approximately 50 basis points
- The 2-year Treasury rose approximately 75–80 basis points
- As of May 21, the 10-year Treasury stood at approximately 4.60%
This move is attributed to geopolitical dynamics (including the situation around Iran) and a declining global appetite for U.S. Treasuries, with recent auctions clearing at progressively higher yields. Market consensus projects the 10-year to reach approximately 4.8% by December 2026 and to remain above 4% for the next 2–3 years.

Figure 7: Treasury Yield Curves — January through May 2026
Mortgage Rates — Back to Summer 2025 Levels
Mortgage rates have given back much of the progress made earlier in the year. As of the call date, the Freddie Mac primary survey rate was 6.51% and the Mortgage News Daily rate was 6.65% — levels last seen in August 2025. The expectation is that mortgage rates will remain at or above 6.25% for the foreseeable future, with a sub-6% rate considered unlikely in the near term.

Figure 8: 10-Year Treasury Yield Forecast and Primary Mortgage Rate Trend (Mortgage News Daily, MBA, Freddie Mac)
Inflation — Staying Elevated
The April 2026 CPI print came in at 3.8% year-over-year; core CPI (excluding food and energy) ran at 2.8%, well above the Fed’s 2% target. The PCE index was not yet published at call time but was expected to confirm continued inflationary pressure. Combined with stable unemployment, this leaves the Fed with limited flexibility to ease.
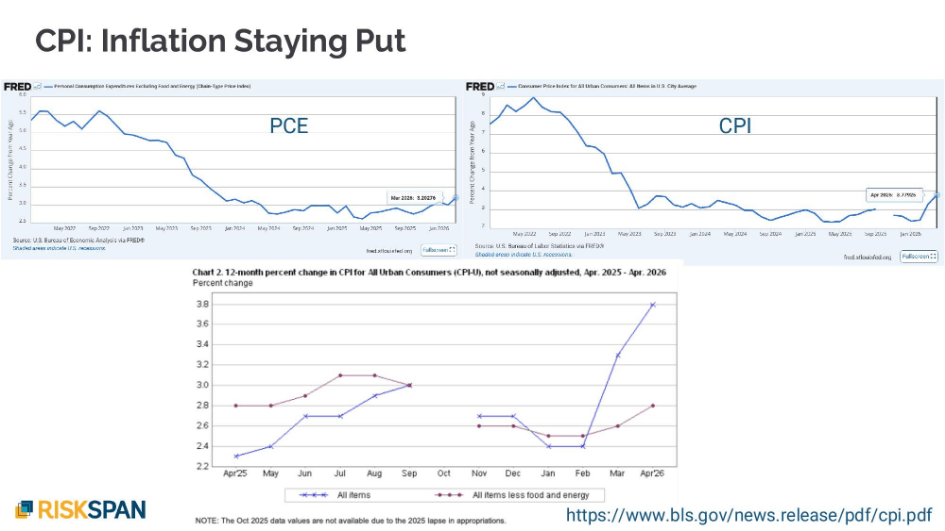
Figure 9: PCE Inflation (ex. Food & Energy) and CPI — Year-over-Year % Change
Home Prices — Stagnating, with Pronounced Regional Variation
National home price growth has slowed to near-zero. The Case-Shiller National Index showed approximately +0.67% year-over-year as of February 2026, while the 10-City Composite came in at +1.74%, suggesting urban markets are modestly outperforming. Regional divergence is pronounced: San Francisco has recorded negative price growth for approximately the past six months (-0.34% YoY), while New York remains solidly positive at +4.78%.
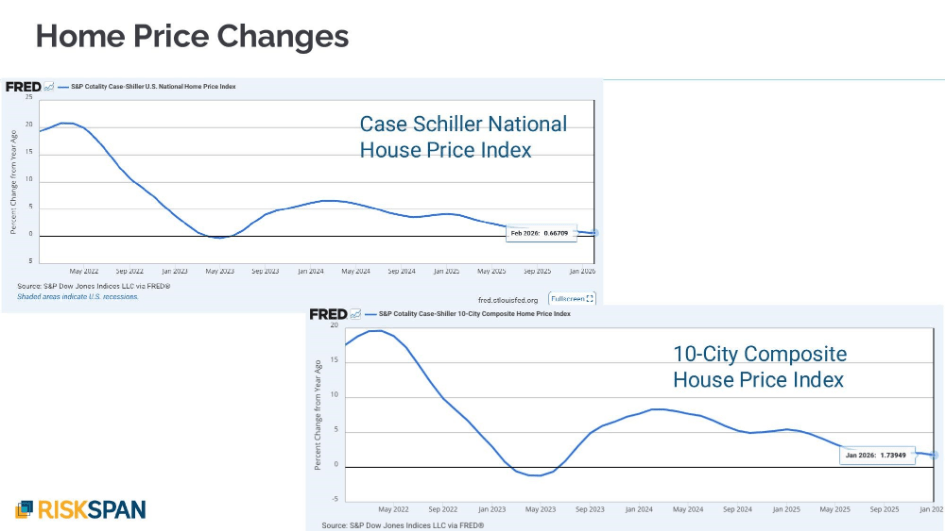
Figure 10: Case-Shiller National and 10-City Composite Home Price Indices — Year-over-Year % Change

Figure 11: Case-Shiller San Francisco and New York Home Price Indices — Year-over-Year % Change
Consumer Stress: Evidence from Credit Card Spending
This month’s call featured a deep dive into consumer financial stress, drawing on research from the Federal Reserve Bank of Boston. The analysis is particularly relevant to mortgage credit risk given evidence of rising delinquencies in FHA and Non-QM collateral.
Credit Landscape
Agency loans (excluding FHA) continue to show low delinquency rates with no significant deterioration. FHA, however, is exhibiting elevated delinquencies that remain high even after accounting for the trial modification policy introduced in October 2025, which holds more loans in delinquent states during the modification process. The Non-QM universe has also begun to show a rising delinquency trend over the past 12–18 months.
Boston Fed Analysis: Spending and Debt by Income Group
A study from the Federal Reserve Bank of Boston segments credit card behavior across three income cohorts and reveals a striking disparity between spending levels and outstanding balances:
- Low-income ($0–$39K): monthly spending ~$25B vs. revolving debt ~$80B — a 3x ratio; this group is primarily revolving rather than paying off balances
- Middle-income ($59K–$83K): spending ~$37B vs. debt ~$105B — also approximately a 3x ratio
- High-income ($121K+): spending ~$170B vs. debt ~$185B — roughly 1:1, consistent with transactor behavior (spend and pay off monthly)
Low- and middle-income households are therefore carrying roughly three months’ worth of spending as permanent revolving debt, at credit card APRs recently running around 23% on new issuances. Total credit card outstanding nationally has reached approximately $1.25 trillion.

Figure 12: Aggregate Credit Card Spending by Income Group, January 2015–May 2025 (Source: Boston Fed / Federal Reserve Y-14M)

Figure 13: Aggregate Credit Card Debt by Income Group, January 2015–April 2025 (Source: Boston Fed / Federal Reserve Y-14M)
Buy Now, Pay Later: An Untracked Risk
Buy now, pay later (BNPL) services have grown rapidly and appear to be used disproportionately by lower-income households. Because BNPL obligations are not reported to credit bureaus, they represent an invisible liability not reflected in standard debt figures. The team flagged this as a developing risk to monitor, particularly for its potential impact on borrower liquidity and mortgage performance in the FHA universe.
Summary
| Topic | Key Takeaway |
| Prepayment Model | Performing well overall; April discount speeds stable (turnover-driven); May premium speeds fell sharply on March rate sell-off and S-curve flattening |
| GNMA Performance | Discount speeds supported by turnover; premium speeds declined moderately but more resilient than conventional counterparts |
| Non-QM Credit Model | CM 7.1 beta in June; production release ~July 10; dedicated webinar in second half of June |
| Mortgage Rates | Freddie Mac at 6.51%; Mortgage News Daily at 6.65%; back to summer 2025 levels; sub-6.25% rate unlikely near-term |
| Fed Policy | No cuts expected in 2026; CME FedWatch shows meaningful probability of hike later in 2026 or early 2027 |
| Treasury Yields | 10-year up ~50 bps since February; 2-year up ~75–80 bps; consensus at ~4.82% by year-end |
| Inflation | CPI 3.8% YoY (April); core CPI 2.8%; PCE similarly elevated; well above 2% target |
| Home Prices | National ~+0.67% YoY; San Francisco negative; New York +4.78%; highly geography-dependent |
| Consumer Stress | Low/mid-income households revolving 3x monthly spending at ~23% APR; BNPL obligations add hidden risk; FHA and Non-QM delinquencies trending higher |
We continue to add additional analytics reports on the RiskSpan Platform. Please visit www.riskspan.com/request-access to request free access.
As always, please feel free to contact us to discuss or learn more.
Register here for our next monthly model update call: Thursday, May 15th at 1:00 ET.
Note: This post contains highlights from our April 2025 monthly modeling call, which delivered insights into the current economic climate, mortgage model enhancements, and borrower behavior trends. You can register here to watch a recording of the full 28-minute call.
Here’s what you missed:
Market Overview: A Climate of Volatility
With mortgage rates rebounding to 7%, the panel began by acknowledging the choppy waters ahead, flagging 2025 as a year likely to see persistent rate volatility. As recession risks grow and consumer stress indicators rise, modeling accuracy becomes more important than ever.
Notably, consumers are already strained:
- Rising consumer debt burdens
- Increased use of personal loans and second liens for debt consolidation
- Spikes in HEL/HELOC originations and securitizations
- Climbing Non-QM delinquencies, particularly among 2022–2023 vintages
Model Update: Credit Model v. 7.0
RiskSpan’s newly released Credit Model v7 marks a significant upgrade in loan performance modeling:
- Delinquency Transition Matrix core structure
- The model projects:
- Monthly CDR, CPR, and delinquency balances (0 through REO)
- Loss severities, liquidated balances, and P&I flows
- Modular components include:
- State Transition Model
- Severity and Liquidation Timeline Modules
- The model is fully integrated within RiskSpan’s platform, enabling custom inputs for whole loans and securities
This model empowers users with granular delinquency and cash flow forecasting, critical for managing portfolios amid market uncertainty.
Daily vs. Monthly Prepayment Trends: A Granular Look
Key findings here included:
- Daily prepay data showing extreme volatility, but offering early trend visibility
- Trend lines derived from daily data offering good proxies for future behavior
- Notable discrepancies within MBS-level data, especially among higher-coupon pools
RiskSpan’s continued focus on benchmarking these data sources helps refine both near-term and long-term modeling strategies.
Prepayment Behavior of Top-Tier Borrowers
The panel spotlighted borrowers with FICO scores over 800, revealing some counterintuitive dynamics:
- Initial refinance activity is higher in the 800+ cohort—”fastest out of the gate”
- But post-seasoning, refinance rates fall below those of the 700–750 FICO group
- This “crossover pattern” reflects a phenomenon the team called “Accelerated Burnout”
- Assumed strategic behavior, like exploiting lender credits, may amplify early refinance intensity
These insights underscore the nonlinear and evolving nature of borrower behavior, especially under fluctuating rate environments.
Model Performance: Staying on Track
RiskSpan’s Prepayment Model continues to track closely with actuals, validating its calibration even in today’s turbulent landscape. Combined with Credit Model v7, clients now have powerful tools for capturing credit and prepayment risk with more accuracy than ever.
Be sure to register for next month’s model update call on Thursday, May 15th at 1:00 ET.
Want a deeper dive into the new Credit Model or Prepay insights? Contact me to schedule a session with our modeling experts.
Register here for our next monthly model update call: Thursday, April 17th at 1:00 ET.
Note: This post contains highlights from our March 2025 monthly modeling call. You can register here to watch a recording of the full 28-minute call.
Mortgage and credit markets remain dynamic in early 2025, with macroeconomic conditions driving both volatility and opportunity. In yesterday’s monthly model call, my team and I shared key insights into current market trends, model performance, and what to expect in the coming months.
Market Snapshot: A Mixed Bag
After trending downward in February, mortgage rates ticked up slightly in early March. Despite the fluctuation, expectations are for rates to remain relatively stable until at least summer 2025. Most mortgage-backed securities (MBS) are still deeply out of the money, making housing turnover—not rate refinancing—the dominant prepayment driver.
Macroeconomic signals remain mixed. While unemployment is still low and wage growth continues, inflation shows signs of persistence. The Fed is expected to hold the Fed Funds Rate steady through mid-year, with a potential first cut projected for June. Credit usage is creeping higher—especially in second liens and credit cards—hinting at growing consumer debt stress.
Model Performance and Updates
Prepayment Model
RiskSpan’s prepayment model continues to track closely with actuals across Fannie Mae, Freddie Mac, and Ginnie Mae collateral. The model shows:
- Prepayments rising slightly, particularly among 2023 vintage loans in response to rate moves.
- Delinquent loan behavior providing rich insights: For “out of the money” (OTM) collateral, delinquent loans are showing higher turnover speeds than performing ones, as borrowers try to avoid foreclosure.
- Turnover sensitivity to borrower FICO scores is especially pronounced for delinquent loans—highlighting the need for granular credit analytics.
These behavioral insights are informing the next version of our prepayment model, which will incorporate GSE data research to enhance forecast accuracy.
Credit Model v7: A Leap Forward
RiskSpan’s new Credit Model v7—now available—is a significant upgrade, built on a delinquency transition matrix framework. This state-transition approach enables monthly projections of:
- Conditional Default Rates (CDR)
- Conditional Prepayment Rates (CPR)
- Loss severity and liquidated balances
- Scheduled and total principal & interest (P&I)
The model’s core components include:
- A vector-based severity model
- A robust liquidation timeline module
- Loan-level outputs by delinquency state (including foreclosure and REO)
By modeling the lifecycle of loans and MSRs more explicitly, Credit Model v7 delivers deeper insight into portfolio credit performance, even in volatile markets.
Emerging Risks and Opportunities
Consumer credit balances—especially HELs and HELOCs—have grown significantly, fueled in part by debt consolidation. Credit card utilization has jumped from 22% in 2020 to nearly 30% as of late 2024, indicating growing financial strain.
Meanwhile, delinquencies in the Non-QM space (2022-2023 vintages) are rising—suggesting that investors need enhanced tools to monitor and manage these risks. RiskSpan’s tools, including the enhanced credit model and daily prepay monitoring, help investors keep pace with these shifting dynamics.
Looking Ahead
RiskSpan’s modeling team remains focused on:
- Continuing to improve prepayment modeling with newly available GSE data
- Rolling out and enhancing Credit Model v7 for broader use cases
- Providing clients with forward-looking analytics to anticipate credit stress and capitalize on market dislocations
Be sure to register for next month’s model update call on Thursday, April 17th at 1:00 ET.
Want a deeper dive into the new Credit Model or Prepay insights? Contact me to schedule a session with our modeling experts.
Note: This post contains highlights from our February 2025 monthly modeling call. You can register here to watch a recording of the full call (approx. 25 mins).
As we move further into 2025, key trends are emerging in the mortgage and credit markets, shaping risk management strategies for lenders, investors, and policymakers alike. RiskSpan’s latest model update highlights critical developments in mortgage prepayments, credit performance, and consumer debt trends—offering valuable insights for investors, traders, and portfolio/risk managers in these spaces.
Prepayment Trends: High rates = Slowing Speeds
Prepayment speeds have continued to decline in Q1 2025, largely due to a lack of housing turnover and persistently high mortgage rates. While a drop in rates during Q3 2024 temporarily mitigated lock-in effects for borrowers with very low rates, MBS speeds remain low across most cohorts.
Key drivers of observed prepayment behavior include:
- Mortgage rates are expected to stay high (~6.5%+) throughout 2025, keeping refinancing activity muted.
- Turnover remains the primary driver of prepayments, with most MBS pools significantly out of the money.
- RiskSpan’s Prepayment Model v3.7 effectively captures these dynamics, particularly the impact of deep out-of-the-money (OTM) speeds based on moneyness.
Credit Market Trends: Rising Non-QM Delinquencies and Debt Pressures
Growth in Non-QM and Second Lien Originations
The private credit market continues to expand, with increasing Non-QM and second lien originations. However, a concerning delinquency trend has emerged, with delinquencies among 2022-2023 Non-QM vintages now rising faster than among older vintages.
Consumer Debt Pressures Mounting
Consumer debt continues to rise rapidly, raising concerns about long-term credit performance:
- Credit card balances have increased significantly, with utilization climbing from 22% in 2020 to 30% by late 2024.
- More consumers are turning to personal loans for debt consolidation, a sign of financial strain.
- Second liens (HEL/HELOCs) are being used to pay off high-interest debt, fueled by strong home equity growth since 2020.
Model Enhancements
To address these evolving market conditions, RiskSpan has rolled out key enhancements to its mortgage and credit models:
- Prepayment Model v3.7 – Captures deep out-of-the-money lock-in effects with improved accuracy across Fannie, Freddie, and Ginnie collateral.
- Credit Model v7 – Introduces a Delinquency Transition Matrix, providing more granular forecasting for loans and MSR valuation.
- Non-QM Prepayment Model – Developed using CoreLogic data, offering improved prepayment insights for Non-QM loans.
Looking Ahead
- Rates are likely to remain high, with no reductions expected before summer.
- Home equity growth remains strong, driving continued second lien origination.
- Debt servicing costs are beginning to strain consumers, as high interest rates persist.
- Delinquency rates show strong correlation to credit quality, signaling potential risks ahead.
The evolving mortgage and credit landscape underscores the importance of robust modeling and risk assessment. With prepayments slowing, debt burdens rising, and consumer credit trends shifting, lenders and investors must adapt their strategies accordingly.
The non-QM mortgage market is showing clear signs of stress, and the latest delinquency data confirms it. RiskSpan analysis shows 60+ day delinquencies are rising, with 2022 and 2023 vintages deteriorating faster than prior years. Non-Qualified Mortgages (Non-QM) are loans that don’t meet traditional underwriting guidelines and often include self-employed borrowers, investors, and those with alternative income documentation.

What’s Driving the Spike?
Sustained higher mortgage rates have created pressure for some non-QM borrowers with fewer refinancing options. A more granular analysis shows loan attributes and risk layering driving high delinquencies, particularly those with cashout refi as the loan purpose. In a slowing home price appreciation (HPA) environment, borrowers who took out cash-out refis may be struggling with payment shock and limited home equity growth.
But the Real Problem? The Changing Housing Market.
Since the Covid crisis, many believed low housing inventory would keep prices elevated, but not anymore. The Wall Street Journal reported last week that housing inventory rose by 16% compared to the previous year. Further, the Federal Reserve Economic Data (FRED) shows 2024 HPA at just +3.5%, the slowest since 2020 with certain MSAs declining. Florida remains its own unique case, while DC faces recession fears following recent Trump policy changes. 2025 looks even weaker – WS research projects HPA at just +2.5%, signaling even slower home price growth ahead.
The Risk: What Comes Next?
Slower home price growth means reduced equity cushions and borrowers with less ability to absorb financial shocks. This means refinancing and selling become less viable options leading to rising delinquencies & liquidity concerns. The markets could certainly stabilize or non-QM delinquencies could continue their upward climb.
Learn more about how one whole loan and MSR investor (a large mortgage REIT) successfully overhauled its analytics computational processing with RiskSpan. The investor migrated from a daily pricing and risk process that relied on tens of thousands of rep lines to one capable of evaluating each of the portfolio’s more than three-and-a-half million loans individually (and how they actually saved money in the process).
The Situation
One of the industry’s largest mortgage REITs sought a more forward-thinking way of managing its extensive investment portfolio of mortgage servicing rights (MSR) assets, residential loans and securities. The REIT runs a battery of sophisticated risk management analytics that rely on stochastic modeling. Option-adjusted spread, duration, convexity, and key rate durations are calculated based on more than 200 interest rate simulations.
The investor used rep lines for one main reason: it needed a way to manage computational loads on the server and improve calculation speeds. Secondarily, organizing the loans in this way simplified the reporting and accounting requirements to a degree (loans financed by the same facility were grouped into the same rep line).
This approach had some significant downsides. Pooling loans by finance facility was sometimes causing loans with different balances, LTVs, credit scores, etc., to get grouped into the same rep line. This resulted in prepayment and default assumptions getting applied to every loan in a rep line that differed from the assumptions that likely would have been applied if the loans were being evaluated individually.
The Challenge
The main challenge was the investor’s MSR portfolio—specifically, the volume of loans needing to be run. Having close to 4 million loans spread across nine different servicers presented two related but separate sets of challenges.
The first set of challenges stemmed from needing to consume data from different servicers whose file formats not only differed from one another but also often lacked internal consistency. Even the file formats from a single given servicer tended to change from time to time. This required RiskSpan to continuously update its data mappings and (because the servicer reporting data is not always clean) modify QC rules to keep up with evolving file formats.
The second challenge related to the sheer volume of compute power necessary to run stochastic paths of Monte Carlo rate simulations on 4 million individual loans and then discount the resulting cash flows based on option adjusted yield across multiple scenarios.
And so there were 4 million loans times multiple paths times one basic cash flow, one basic option-adjusted case, one up case, and one down case—it’s evident how quickly the workload adds up. And all this needed to happen on a daily basis.
To help minimize the computing workload, the innovative REIT had devised a way of running all these daily analytics at a rep-line level—stratifying and condensing everything down to between 70,000 and 75,000 rep lines. This alleviated the computing burden but at the cost of decreased accuracy because they could not look at the loans individually.
The Solution
The analytics computational processing RiskSpan implemented ignores the rep line concept entirely and just runs the loans. The scalability of our cloud-native infrastructure enables us to take the nearly four million loans and bucket them equally for computation purposes. We run a hundred loans on each processor and get back loan-level cash flows and then generate the output separately, which brings the processing time down considerably.
For each individual servicer, RiskSpan leveraged its Smart Mapper technology and Configurable QC feature in its Edge Platform to create a set of optimized loan files that can be read and rendered “analytics-ready” very quickly. This enables the loan-level data to be quickly consumed and immediately used for analytics without having to read all the loan tapes and convert them into a format that an analytics engine can understand. Because RiskSpan has “pre-processed” all this loan information, it is immediately available in a format that the engine can easily digest and run analytics on.
What this means for you
An investor in any mortgage asset benefits from the ability to look at and evaluate loan characteristics individually. The results may need to be rolled up and grouped for reporting purposes. But being able to run the cash flows at the loan level ultimately makes the aggregated results vastly more meaningful and reliable. A loan-level framework also affords whole-loan and securities investors the ability to be sure they are capturing the most important loan characteristics and are staying on top of how the composition of the portfolio evolves with each day’s payoffs.
One of the things that makes modeling loan and MSR cash flows hard is appropriately applying assumptions to individual loans. Creating appropriate assumptions for each loan or MSR segment is crucial to estimating realistic performance scenarios, stress testing, hedging, and valuation. However, manually creating and maintaining such assumptions can be time-consuming, error-prone, and inconsistent across different segments and portfolios.
Fortunately, hidden among some of the Edge Platform’s better-known features is a powerful and flexible way of running loan-level analytics on a portfolio using the Platform’s segment builder and loan model assumptions features.
These sometimes-overlooked features allow users to create and apply granular and customized modeling assumptions to a particular loan portfolio, based on its various, unique loan characteristics. Assumptions can be saved and reused for future analysis on different loans tapes. This feature allows clients to effectively build and manage a complex system of models adjustment and tuners for granular sub-segments.
Applying the segment builder and loan model assumptions features, loan investors can:
-
- Decouple how they run and aggregate results from how they assign modeling assumptions, and seamlessly assign different assumptions to various segments of the portfolio, based on user-defined criteria and preferences. For example, investors can assign different prepayment, default, and severity assumptions to loans based on their state, LTV, UPB, occupancy, purpose, delinquency status, loan type, collateral features, or virtually any other loan characteristic.

-
- Choose from a variety of models and inputs, including RiskSpan models and vector inputs for things like CPR and CDR. Investors can define their own vector inputs as an aging curves by loan age or based on the forecast month, and apply them to different segments of the portfolio. For example, they can define their own CDR and CPR curves for consumer or C&I loans, based on the age of the loans.

-
- Set up and save modeling assumptions one time, and then reference them over and over again whenever new loan tapes are uploaded. This saves time and effort and ensures consistency and accuracy in the analysis.

This hidden feature enables investors to customize their analysis and projections for different asset classes and scenarios, and to leverage the Edge Platform’s embedded cash flow, prepayment and credit models without compromising the granularity and accuracy of the results. Users can create and save multiple sets of loan model assumptions that include either static inputs, aging curves, or RiskSpan models, and apply them to any loan tape they upload and run in the forecasting UI.
Contact us and request a free demo or trial to learn more about how to use these and other exciting hidden (and non-hidden) features and how they can enhance your loan analytics.
The way RMBS dealers communicate loan-level details to prospective investors today leaves a lot to be desired.
Any investor who has ever had to work with pre-issue Intex CDI files can attest to the problematic nature of the loan data they contain. Some are better than others, but virtually all of them lack information about any number of important loan features.
Investors can typically glean enough basic information about balances and average note rates from preliminary CDI files to run simple, static CPR/CDR scenarios. But information needed to run complex models — FICO scores, property characteristics and geography, and LTV ratios to name a few — is typically lacking. MBS investors who want to run to run more sophisticated prepayment and credit models – models that rely on more comprehensive loan-level datasets to run deeper analytics and scenarios – can be left holding the bag when these details are missing from the CDI file.
The loan-level detail exists – it’s just not in the CDI file. Loan-level detail often accompanies the CDI file in a separate spreadsheet (still quaintly referred to in the 21st Century as a “loan tape”). Having this data separate from the CDI file requires investors to run the loan tape through their various credit and prepayment models and then manually feed those results back into the Intex CDI file to fully visualize the deal structure and expected cash flows.
This convoluted, multi-step workaround adds both time and the potential for error to the pre-trade analytics process.
A Better Way
Investors using RiskSpan’s Edge Platform can streamline the process of evaluating a deal’s structure alongside the expected performance of its underlying mortgage loans into a single step.

Here is how it works.
As illustrated above, when investors set up their analytical runs on Edge, RiskSpan’s proprietary credit and prepayment models automatically extract all the required loan-level data from the tape and then connect the modeling results to the appropriate corresponding deal tranche in the CDI file. This seamlessness reduces all the elements of the pre-trade analytics process down to a matter of just a few clicks.
Making all this possible is the Edge Platform’s Smart Mapper ETL solution, which allows it to read and process loan tapes in virtually any format. Using AI, the Platform recognizes every data element it needs to run the underlying analytics regardless of the order in which the data elements are arranged and irrespective of how (or even whether) column headers are used.
Contact us to learn more about how RMBS investors are reaping the benefits of consolidating all of their data analytics on a single cloud-native platform.