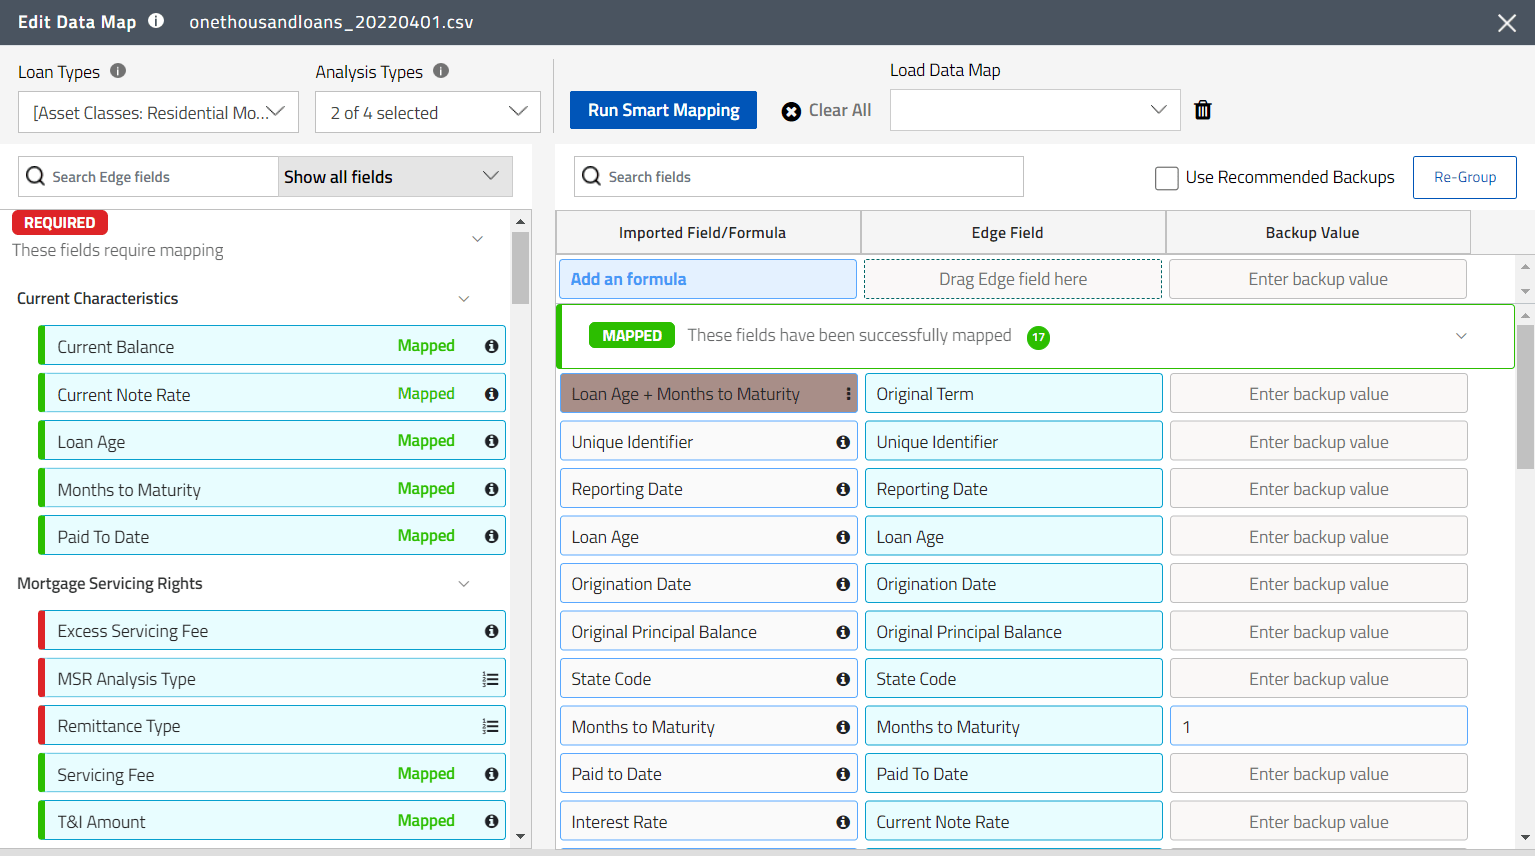
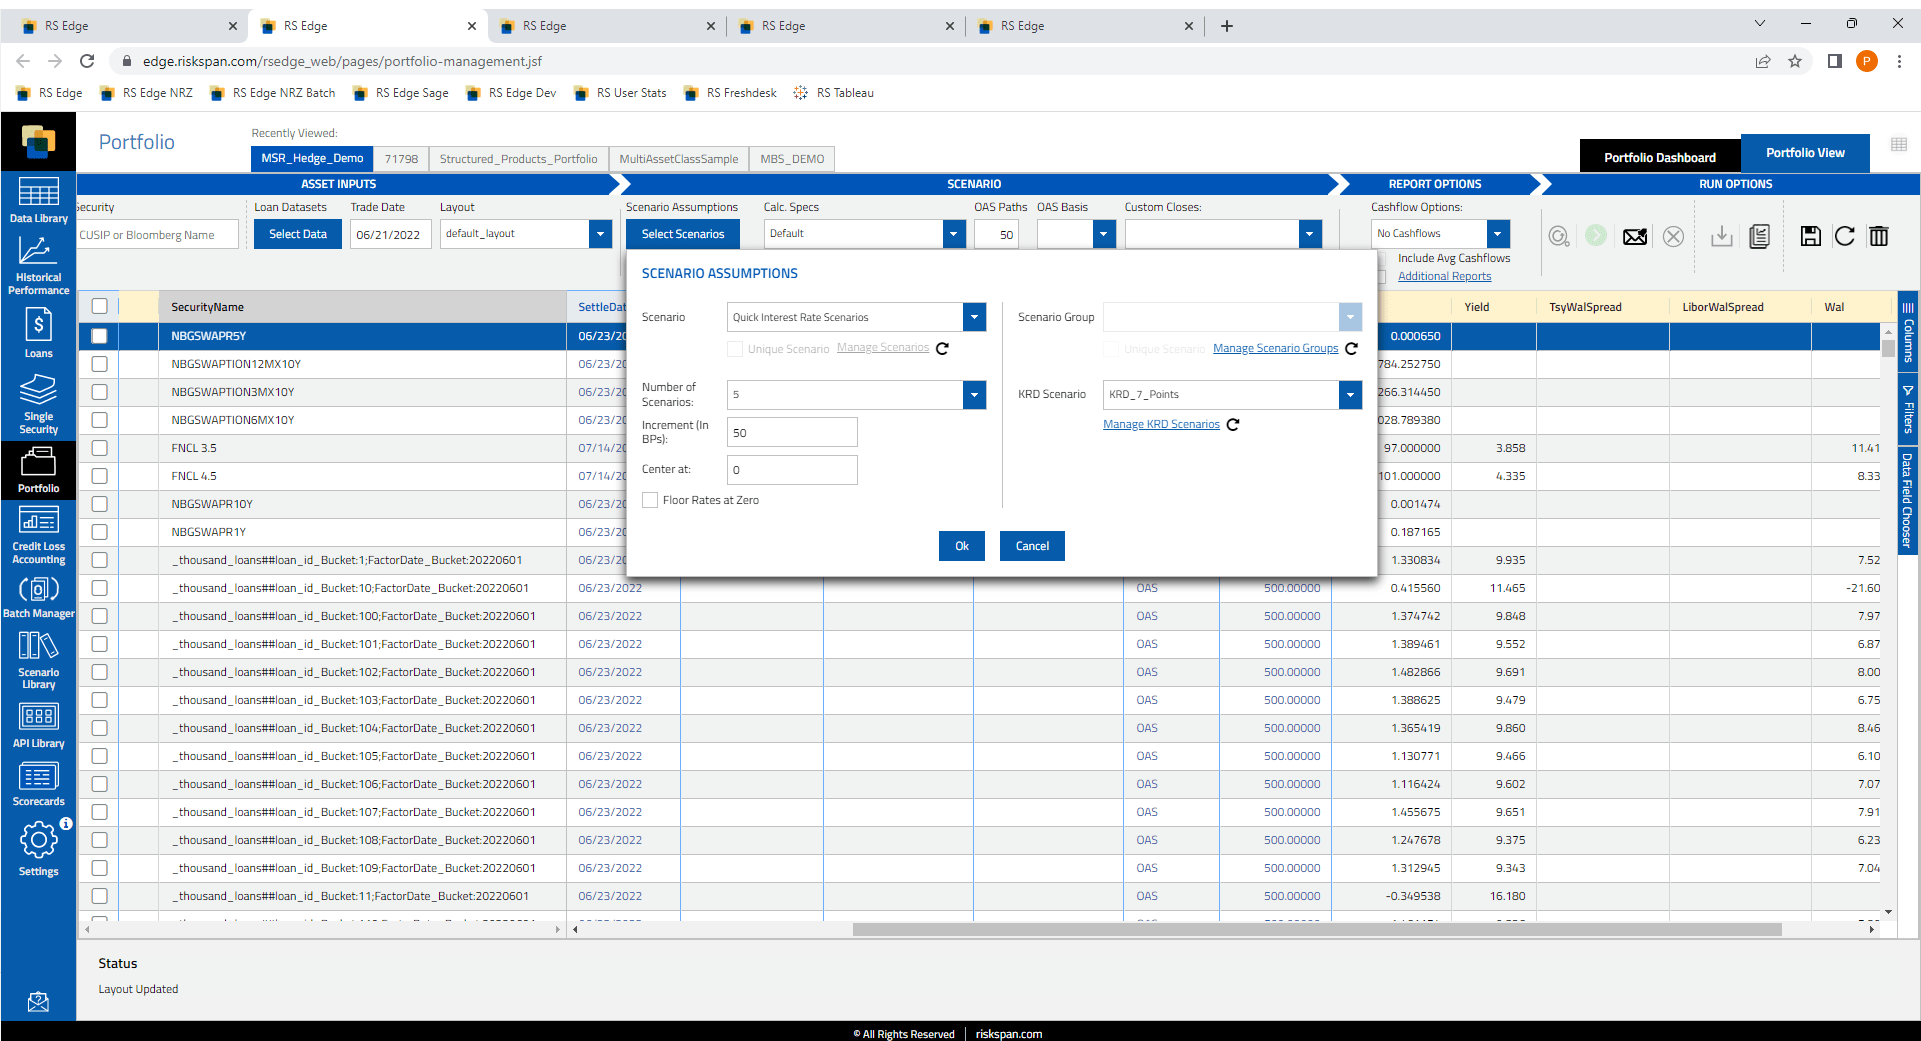
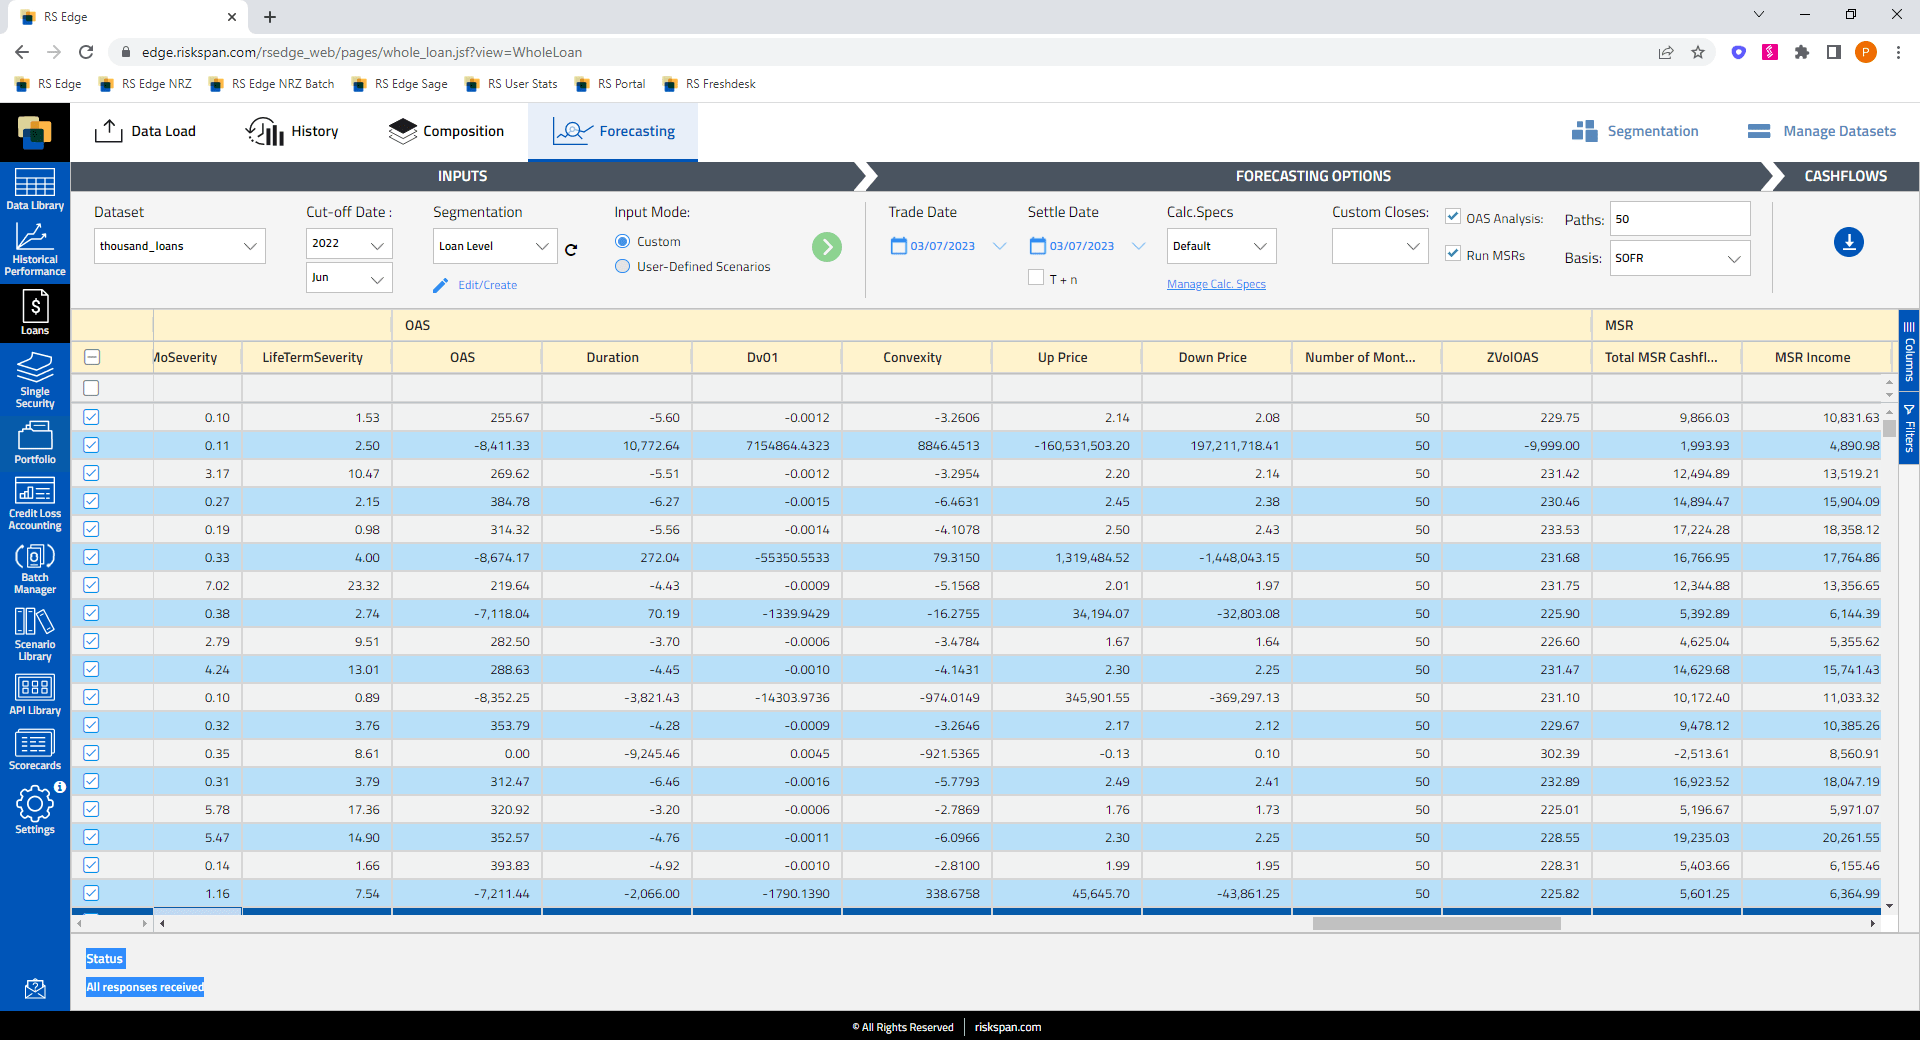
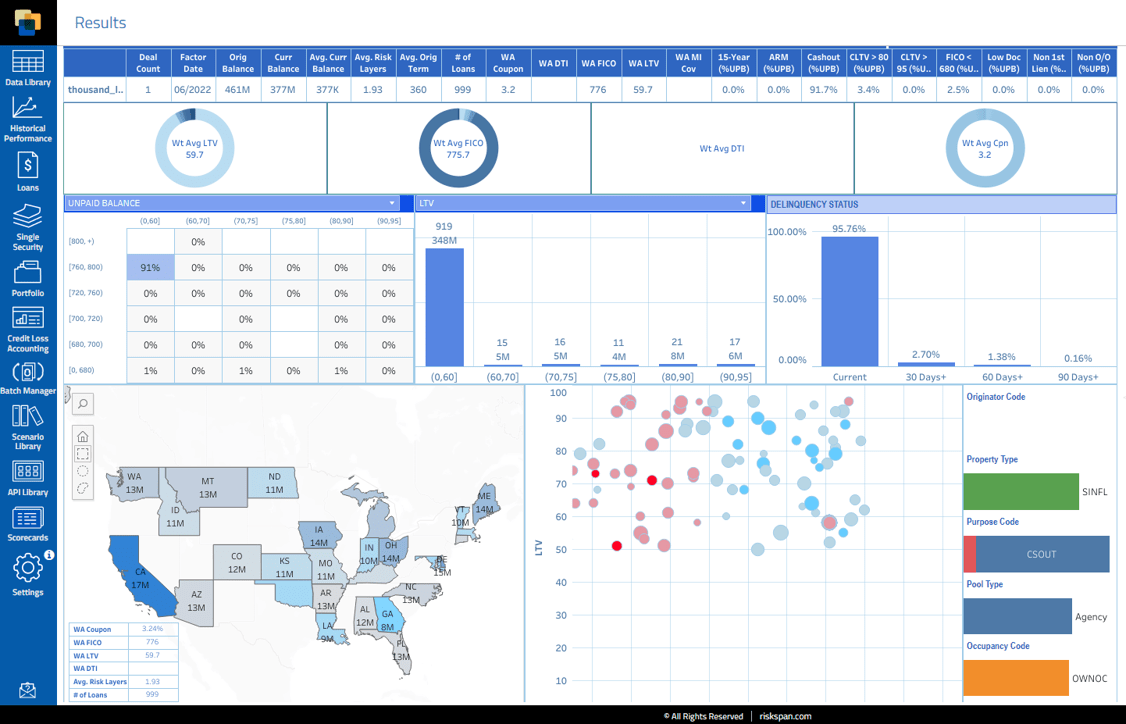
Linkedin    Twitter   Facebook

Get Started
Log In

Linkedin

Articles Tagged with: MSRs

MSR & Loan Trading Insights

RiskSpan’s Edge Platform is the leading comprehensive data and mortgage analytics platform tailored for residential whole loan and MSR trading, empowering investors with advanced cloud technology and AI. By streamlining loan and MSR data management, providing customizable historical performance insights, and powering robust valuation and risk analysis, Riskspan’s Edge Platform automates complex data tasks and identifies critical, loan-level insights. 

Looking for an edge? Read our latest whole loan trading and MSR-related insights below.


FICO

What do 2023 Originations Means for MSRs?

Are you investing in MSRs or considering doing so in the near future? If so, understanding current origination trends and loan characteristics is a critical component of predicting future MSR performance and prepayment risk. Read our latest research post, which looks into key characteristics of 2023 originations.

Trader

Why Accurate Loan Pool and MSR Cost Forecasting Requires Loan-by-Loan Analytics

Loan cohorting has been a useful strategy to limit the computational power necessary to run simulations. But advances in cloud compute and increasing heterogeneity of loan and MSR portfolios means better methods are now available. 

christopher-burns-Kj2SaNHG-hg-unsplash

5 foundational steps for investors to move towards loan-level analyses

It’s critical to leverage your full spectrum of data and run analyses at the loan level rather than cohorting. But what does it take to make the switch to loan-level analytics? Our team has put together a short set of recommendations and considerations for how to tackle an otherwise daunting project.

DAAS

It’s time to move to DaaS — Why it matters for loan and MSR investors

The ability to analyze loan-level granular data is fast becoming the difference between profitable trades and near misses… but operating at the loan level means wading through an ocean of data. Learn about how you can get the most out of your data.

uriel-sc

Case Study: How one investor moved to loan level analysis while reducing their costs

Are you looking to optimize investment decisions while reducing costs? Discover how one loan and MSR investor transformed their analytics using RiskSpan, in our latest case study.

Improving-MSR-Pricing

Whitepaper: Improving the precision of MSR pricing using loan-level analytics

Incorporating both credit and prepayment modeling into an MSR valuation regime requires a loan-by-loan approach to capture the necessary level of granularity, but performing such an analysis has been historically viewed as impractical. Read RiskSpan’s deep-dive whitepaper to explore how today’s cloud-based, loan-level technology can make this not only practical, but cost effective.

Interested In learning about RiskSpan’s Edge Platform?

loan-analytics


Case Study: How one investor moved to loan-level analysis while reducing costs

Learn more about how one investor (a large mortgage REIT) successfully overhauled its analytics computational processing with RiskSpan. The investor migrated from a daily pricing and risk process that relied on tens of thousands of rep lines to one capable of evaluating each of the portfolio’s more than three-and-a-half million loans individually (and how they actually saved money in the process). 

The Situation 

One of the industry’s largest mortgage REITs sought a better way of managing its extensive investment portfolio of mortgage servicing rights (MSR) assets, residential loans and securities. The REIT runs a battery of sophisticated risk management analytics that rely on stochastic modeling. Option-adjusted spread, duration, convexity, and key rate durations are calculated based on more than 200 interest rate simulations.

The investor used rep lines for one main reason: it needed a way to manage computational loads on the server and improve calculation speeds. Secondarily, organizing the loans in this way simplified the reporting and accounting requirements to a degree (loans financed by the same facility were grouped into the same rep line).  

This approach had some significant downsides. Pooling loans by finance facility was sometimes causing loans with different balances, LTVs, credit scores, etc., to get grouped into the same rep line. This resulted in prepayment and default assumptions getting applied to every loan in a rep line that differed from the assumptions that likely would have been applied if the loans were being evaluated individually. 

The Challenge 

The main challenge was the investor’s MSR portfolio—specifically, the volume of loans needing to be run. Having close to 4 million loans spread across nine different servicers presented two related but separate sets of challenges. 

The first set of challenges stemmed from needing to consume data from different servicers whose file formats not only differed from one another but also often lacked internal consistency. Even the file formats from a single given servicer tended to change from time to time. This required RiskSpan to continuously update its data mappings and (because the servicer reporting data is not always clean) modify QC rules to keep up with evolving file formats.  

The second challenge related to the sheer volume of compute power necessary to run stochastic paths of Monte Carlo rate simulations on 4 million individual loans and then discount the resulting cash flows based on option adjusted yield across multiple scenarios. 

And so there were 4 million loans times multiple paths times one basic cash flow, one basic option-adjusted case, one up case, and one down case—it’s evident how quickly the workload adds up. And all this needed to happen on a daily basis. 

To help minimize the computing workload, this client had been running all these daily analytics at a rep-line level—stratifying and condensing everything down to between 70,000 and 75,000 rep lines. This alleviated the computing burden but at the cost of decreased accuracy because they could not look at the loans individually.

The Solution 

The analytics computational processing RiskSpan implemented ignores the rep line concept entirely and just runs the loans. The scalability of our cloud-native infrastructure enables us to take the nearly four million loans and bucket them equally for computation purposes. We run a hundred loans on each processor and get back loan-level cash flows and then generate the output separately, which brings the processing time down considerably. 

For each individual servicer, RiskSpan leveraged its Smart Mapper technology and Configurable QC feature in its Edge Platform to create a set of optimized loan files that can be read and rendered “analytics-ready” very quickly. This enables the loan-level data to be quickly consumed and immediately used for analytics without having to read all the loan tapes and convert them into a format that an analytics engine can understand. Because RiskSpan has “pre-processed” all this loan information, it is immediately available in a format that the engine can easily digest and run analytics on. 

What this means for you

An investor in any mortgage asset benefits from the ability to look at and evaluate loan characteristics individually. The results may need to be rolled up and grouped for reporting purposes. But being able to run the cash flows at the loan level ultimately makes the aggregated results vastly more meaningful and reliable. A loan-level framework also affords whole-loan and securities investors the ability to be sure they are capturing the most important loan characteristics and are staying on top of how the composition of the portfolio evolves with each day’s payoffs. 


5 foundational steps for investors to move towards loan-level analyses

Are you curious about how your organization can uplevel the accuracy of your MSR cost forecasting? The answer lies in leveraging the full spectrum of your data and running analyses at the loan level rather than cohorting. But what does it take to make the switch to loan-level analytics? Our team has put together a short set of recommendations and considerations for how to tackle an otherwise daunting project…

It begins with having the data. Most investors have access to loan-level data, but it’s not always clean. This is especially true of origination data. If you’re acquiring a pool – be it a seasoned pool or a pool right after origination – you don’t have the best origination data to drive your model. You also need a data store, like Snowflake, that can generate loan-loan level output to drive your analytics and models.  

The second factor is having models that work at the loan level – models that have been calibrated using loan-level performance and that are capable of generating loan-level output. One of the constraints of several existing modeling frameworks developed by vendors is they were created to run at a rep line level and don’t necessarily work very well for loan-level projections.

The third requirement is a compute farm. It is virtually impossible to run loan-level analytics if you’re not on the cloud because you need to distribute the computational load. And your computational distribution requirements will change from portfolio to portfolio based on the type of analytics that you are running, based on the types of scenarios that you are running, and based on the models you are using. The cloud is needed not just for CPU power but also for storage. This is because once you go to the loan level, every loan’s data must be made available to every processor that’s performing the calculation. This is where having the kind of shared databases, which are native to a cloud infrastructure, becomes vital. You simply can’t replicate it using an on-premise setup of computers in your office or in your own data center. Adding to this, it’s imperative for mortgage investors to remember the significance of integration and fluidity. When dealing with loan-level analytics, your systems—the data, the models, the compute power—should be interlinked to ensure seamless data flow. This will minimize errors, improve efficiency, and enable faster decision-making.

Fourth—and an often-underestimated component—is having intuitive user interfaces and visualization tools. Analyzing loan-level data is complex, and being able to visualize this data in a comprehensible manner can make all the difference. Dashboards that present loan performance, risk metrics, and other key indicators in an easily digestible format are invaluable. These tools help in quickly identifying patterns, making predictions, and determining the next strategic steps.

Fifth and finally, constant monitoring and optimization are crucial. The mortgage market, like any other financial market, evolves continually. Borrower behaviors change, regulatory environments shift, and economic factors fluctuate. It’s essential to keep your models and analytics tools updated and in sync with these changes. Regular back-testing of your models using historical data will ensure that they remain accurate and predictive. Only by staying ahead of these variables can you ensure that your loan-level analysis remains robust and actionable in the ever-changing landscape of mortgage investment.


How Rithm Capital leverages RiskSpan’s expertise and Edge Platform to enhance data management and achieve economies of scale


BACKGROUND


One of the nation’s largest mortgage loan and MSR investors was hampered by a complex data ingestion process as well as slow and cumbersome on-prem software for pricing and market risk.

A complicated data wrangling process was taking up significant time and led to delays in data processing. Further, month-end risk and financial reporting processes were manual and time-pressured. The data and risk teams were consumed with maintaining the day-to-day with little time available to address longer-term data strategies and enhance risk and modeling processes.


OBJECTIVES

  1. Modernize Rithm’s mortgage loan and MSR data intake from servicers — improve overall quality of data through automated processes and development of a data QC framework that would bring more confidence in the data and associated use cases, such as for calculating historical performance.

  2. Streamline portfolio valuation and risk analytics while enhancing granularity and flexibility through loan-level valuation/risk.

  3. Ensure data availability for accounting, finance and other downstream processes.

  4. Bring scalability and internal consistency to all of the processes above.

THE SOLUTION


THE EDGE WE PROVIDED

By adopting RiskSpan’s cloud-native data management, managed risk, and SaaS solutions, Rithm Capital saved time and money by streamlining its processes

Adopting Edge has enabled Rithm to access enhanced and timely data for better performance tracking and risk management by:

  • Managing data on 5.5 million loans, including source information and monthly updates from loan servicers (with ability in the future to move to daily updates)
  • Ingesting, validating and normalizing all data for consistency across servicers and assets
  • Implementing automated data QC processes
  • Performing granular, loan-level analysis​


With more than 5 million mortgage loans spread across nine servicers, Rithm needed a way to consume data from different sources whose file formats varied from one another and also often lacked internal consistency. Data mapping and QC rules constantly had to be modified to keep up with evolving file formats. 

Once the data was onboarded Rithm required an extraordinary amount of compute power to run stochastic paths of Monte Carlo rate simulations on all 4 million of those loans individually and then discount the resulting cash flows based on option adjusted yield across multiple scenarios.

To help minimize the computing workload, Rithm had been running all these daily analytics at a rep-line level—stratifying and condensing everything down to between 70,000 and 75,000 rep lines. This alleviated the computing burden but at the cost of decreased accuracy and limited reporting flexibility because results were not at the loan-level.

Enter RiskSpan’s Edge Platform.

Combining the strength of RiskSpan’s subject matter experts, quantitative analysts, and technologists together with the power of the Edge platform, RiskSpan has helped Rithm achieve its objectives across the following areas: 

Data management and performance reporting

  • Data intake and quality control for 9 servicers across loan and MSR portfolios
  • Servicer data enrichment
  • Automated data loads leading to reduced processing time for rolling tapes
  • Ongoing data management support and resolution
  • Historical performance review and analysis (portfolio and universe)

Valuation and risk

  • Daily reporting of MSR, mortgage loan and security valuation and risk analytics based on customized Tableau reports
  • MSR and whole loan valuation/risk calculated based at the loan-level leveraging the scalability of the cloud-native infrastructure
  • Additional scenario analysis and other requirements needed for official accounting and valuation purposes

Interactive tools for portfolio management

  • Fast and accurate tape cracking for purchase/sale decision support
  • Ad-hoc scenario analyses based on customized dials and user-settings

The implementation of these enhanced data and analytics processes and increased ability to scale these processes has allowed Rithm to spend less time on day-to-day data wrangling and focus more on higher-level data analysis and portfolio management. The quality of data has also improved, which has led to more confidence in the data that is used across many parts of the organization.


LET US BUILD YOUR SOLUTION

Models + Data management = End-to-end Managed Process

The economies of scale we have achieved by being able to consolidate all of our portfolio risk, interactive analytics, and data warehousing onto a single platform are substantial. RiskSpan’s experience with servicer data and MSR analytics have been particularly valuable to us.

          — Head of Analytics


RiskSpan Unveils New “Reverse ETL” Mortgage Data Mapping and Extract Functionality

ARLINGTON, Va., October 19, 2022 – Subscribers to RiskSpan’s Mortgage Data Management product can now not only leverage machine learning to streamline the intake of loan data from any format, but also define any target format for data extraction and sharing.

A recent enhancement to RiskSpan’s award-winning Edge Platform enables users to take in unformatted datasets from mortgage servicers, sellers and other counterparties and convert them into their preferred data format on the fly for sharing with accounting, client, and other downstream systems.

Analysts, traders, and portfolio managers have long used Edge to take in and store datasets, enabling them to analyze historical performance of custom cohorts using limitless combinations of mortgage loan characteristics and run predictive analytics on segments defined on the fly. With Edge’s novel “Reverse ETL” data extract functionality, these Platform users can now also easily and fully design an export format for exporting their data, creating the functional equivalent of a full integration node for sharing data with literally any system on or off the Edge Platform.   

Market participants tout the revolutionary technology as the end of having to share cumbersome and unformatted CSV files with counterparties. Now, the same smart mapping technology that for years has facilitated the ingestion of mortgage data onto the Edge Platform makes extracting and sharing mortgage data with downstream users just as easy.   

Comprehensive details of this and other new capabilities using RiskSpan’s Edge Platform are available by requesting a no-obligation live demo at riskspan.com.

SCHEDULE A FREE DEMO

This new functionality is the latest in a series of enhancements that is making the Edge Platform’s Data as a Service increasingly indispensable for mortgage loan and MSR traders and investors.

### 

About RiskSpan, Inc. 

RiskSpan is a leading technology company and the most comprehensive source for data management and analytics for residential mortgage and structured products. The company offers cloud-native SaaS analytics for on-demand market risk, credit risk, pricing and trading. With our data science experts and technologists, we are the leader in data as a service and end-to-end solutions for loan-level data management and analytics.

Our mission is to be the most trusted and comprehensive source of data and analytics for loans and structured finance investments.

Rethink loan and structured finance data. Rethink your analytics. Learn more at www.riskspan.com.

Media contact: Timothy Willis

CONTACT US


Bumpy Road Ahead for GNMA MBS?

In a recent webinar, RiskSpan’s Fowad Sheikh engaged in a robust discussion with two of his fellow industry experts, Mahesh Swaminathan of Hilltop Securities and Mike Ortiz of DoubleLine Group, to address the likely road ahead for Ginnie Mae securities performance.


The panel sought to address the following questions:

  • How will the forthcoming, more stringent originator/servicer financial eligibility requirements affect origination volumes, buyouts, and performance?
  • Who will fill the vacuum left by Wells Fargo’s exiting the market?
  • What role will falling prices play in delinquency and buyout rates?
  • What will be the impact of potential Fed MBS sales.

This post summarizes some the group’s key conclusions. A recording of the webinar in its entirety is available here.

GET STARTED

Wells Fargo’s Departure

To understand the the likely impact of Wells Fargo’s exit, it is first instructive to understand the declining market share of banks overall in the Ginnie Mae universe. As the following chart illustrates, banks as a whole account for just 11 percent of Ginnie Mae originations, down from 39 percent as recently as 2015.

Drilling down further, the chart below plots Wells Fargo’s Ginnie Mae share (the green line) relative to the rest of the market. As the chart shows, Wells Fargo accounts for just 3 percent of Ginnie Mae originations today, compared to 15 percent in 2015. This trend of Wells Fargo’s declining market share extends all the way back to 2010, when it accounted for some 30 percent of Ginnie originations.

As the second chart below indicates, Wells Fargo’s market share, even among banks has also been on a steady decline.

GeT A Free Trial or Demo

Three percent of the overall market is meaningful but not likely to be a game changer either in terms of origination trends or impact on spreads. Wells Fargo, however, continues to have an outsize influence in the spec pool market. The panel hypothesized that Wells’s departure from this market could open the door to other entities claiming that market share. This could potentially affect prepayment speeds – especially if Wells is replaced by non-bank servicers, which the panel felt was likely given the current non-bank dominance of the top 20 (see below) – since Wells prepays have traditionally been slightly better than the broader market.

The panel raised the question of whether the continuing bank retreat from Ginnie Mae originations would adversely affect loan quality. As basis for this concern, they cited the generally lower FICO scores and higher LTVs that characterize non-bank-originated Ginnie Mae mortgages (see below). 

These data notwithstanding, the panel asserted that any changes to credit quality would be restricted to the margins. Non-bank servicers originate a higher percentage of lower-credit-quality loans (relative to banks) not because non-banks are actively seeking those borrowers out and eschewing higher-credit-quality borrowers. Rather, banks tend to restrict themselves to borrowers with higher credit profiles. Non-banks will be more than happy to lend to these borrowers as banks continue to exit the market.

Effect of New Eligibility Requirements

The new capital requirements, which take effect a year from now, are likely to be less punitive than they appear at first glance. With the exception of certain monoline entities – say, those with almost all of their assets concentrated in MSRs – the overwhelming majority of Ginnie Mae issuers (banks and non-banks alike) are going to be able meet them with little if any difficulty.

Ginnie Mae has stated that, even if the new requirements went into effect tomorrow, 95 percent of its non-bank issuers would qualify. Consequently, the one-year compliance period should open the door for a fairly smooth transition.

To the extent Ginnie Mae issuers are unable to meet the requirements, a consolidation of non-bank entities is likely in the offing. Given that these institutions will likely be significant MSR investors, the potential increase in MSR sales could impact MSR multiples and potentially disrupt the MSR market, at least marginally.

Potential Impacts of Negative HPA

Ginnie Mae borrowers tend to be more highly leveraged than conventional borrowers. FHA borrowers can start with LTVs as high as 97.5 percent. VA borrowers, once the VA guarantee fee is rolled in, often have LTVs in excess of 100 percent. Similar characteristics apply to USDA loans. Consequently, borrowers who originated in the past two years are more likely to default as they watch their properties go underwater. This is potentially good news for investors in discount coupons (i.e., investors who benefit from faster prepay speeds) because these delinquent loans will be bought out quite early in their expected lives.

More seasoned borrowers, in contrast, have experienced considerable positive HPA in recent years. The coming forecasted decline should not materially impact these borrowers’ performance. Similarly, if HPD in 2023 proves to be mild, then a sharp uptick in delinquencies is unlikely, regardless of loan vintage or LTV. Most homeowners make mortgage payments because they wish to continue living in their house and do not seriously consider strategic defaults. During the financial crisis, most borrowers continued making good on their mortgage obligations even as their LTVs went as high as the 150s.

Further, the HPD we are likely to encounter next year likely will not have the same devastating effect as the HPD wave that accompanied the financial crisis. Loans on the books today are markedly different from loans then. Ginnie Mae loans that went bad during the crisis disproportionately included seller-financed, down-payment-assistance loans and other programs lacking in robust checks and balances. Ginnie Mae has instituted more stringent guidelines in the years since to minimize the impact of bad actors in these sorts of programs.

This all assumes, however, that the job market remains robust. Should the looming recession lead to widespread unemployment, that would have a far more profound impact on delinquencies and buyouts than would HPD.

Fed Sales

The Fed’s holdings (as of 9/21, see chart below) are concentrated around 2 percent and 2.5 percent coupons. This raises the question of what the Fed’s strategy is likely to be for unwinding its Ginnie Mae position.

Word on the street is that Fed sales are highly unlikely to happen in 2022. Any sales in 2023, if they happen at all, are not likely before the second half of the year. The panel opined that the composition of these sales is likely to resemble the composition of the Fed’s existing book – i.e., mostly 2s, 2.5s, and some 3s. They have the capacity to take a more sophisticated approach than a simple pro-rata unwinding. Whether they choose to pursue that is an open question.

The Fed was a largely non-economic buyer of mortgage securities. There is every reason to believe that it will be a non-economic seller, as well, when the time comes. The Fed’s trading desk will likely reach out to the Street, ask for inquiry, and seek to pursue an approach that is least disruptive to the mortgage market.

Conclusion

On closer consideration, many of these macro conditions (Wells’s exit, HPD, enhanced eligibility requirements, and pending Fed sales) that would seem to portend an uncertain and bumpy road for Ginnie Mae investors, may turn out to be more benign than feared.

Conditions remain unsettled, however, and these and other factors certainly bear watching as Ginnie Mae market participants seek to plot a prudent course forward.


Optimizing Analytics Computational Processing 

We met with RiskSpan’s Head of Engineering and Development, Praveen Vairavan, to understand how his team set about optimizing analytics computational processing for a portfolio of 4 million mortgage loans using a cloud-based compute farm.

This interview dives deeper into a case study we discussed in a recent interview with RiskSpan’s co-founder, Suhrud Dagli.

Here is what we learned from Praveen. 


Speak to an Expert

Could you begin by summarizing for us the technical challenge this optimization was seeking to overcome? 

PV: The main challenge related to an investor’s MSR portfolio, specifically the volume of loans we were trying to run. The client has close to 4 million loans spread across nine different servicers. This presented two related but separate sets of challenges. 

The first set of challenges stemmed from needing to consume data from different servicers whose file formats not only differed from one another but also often lacked internal consistency. By that, I mean even the file formats from a single given servicer tended to change from time to time. This required us to continuously update our data mapping and (because the servicer reporting data is not always clean) modify our QC rules to keep up with evolving file formats.  

The second challenge relates to the sheer volume of compute power necessary to run stochastic paths of Monte Carlo rate simulations on 4 million individual loans and then discount the resulting cash flows based on option adjusted yield across multiple scenarios. 

And so you have 4 million loans times multiple paths times one basic cash flow, one basic option-adjusted case, one up case, and one down case, and you can see how quickly the workload adds up. And all this needed to happen on a daily basis. 

To help minimize the computing workload, our client had been running all these daily analytics at a rep-line level—stratifying and condensing everything down to between 70,000 and 75,000 rep lines. This alleviated the computing burden but at the cost of decreased accuracy because they couldn’t look at the loans individually. 

What technology enabled you to optimize the computational process of running 50 paths and 4 scenarios for 4 million individual loans?

PV: With the cloud, you have the advantage of spawning a bunch of servers on the fly (just long enough to run all the necessary analytics) and then shutting it down once the analytics are done. 

This sounds simple enough. But in order to use that level of compute servers, we needed to figure out how to distribute the 4 million loans across all these different servers so they can run in parallel (and then we get the results back so we could aggregate them). We did this using what is known as a MapReduce approach. 

Say we want to run a particular cohort of this dataset with 50,000 loans in it. If we were using a single server, it would run them one after the other – generate all the cash flows for loan 1, then for loan 2, and so on. As you would expect, that is very time-consuming. So, we decided to break down the loans into smaller chunks. We experimented with various chunk sizes. We started with 1,000 – we ran 50 chunks of 1,000 loans each in parallel across the AWS cloud and then aggregated all those results.  

That was an improvement, but the 50 parallel jobs were still taking longer than we wanted. And so, we experimented further before ultimately determining that the “sweet spot” was something closer to 5,000 parallel jobs of 100 loans each. 

Only in the cloud is it practical to run 5,000 servers in parallel. But this of course raises the question: Why not just go all the way and run 50,000 parallel jobs of one loan each? Well, as it happens, running an excessively large number of jobs carries overhead burdens of its own. And we found that the extra time needed to manage that many jobs more than offset the compute time savings. And so, using a fair bit of trial and error, we determined that 100-loan jobs maximized the runtime savings without creating an overly burdensome number of jobs running in parallel.  

Get A Demo

You mentioned the challenge of having to manage a large number of parallel processes. What tools do you employ to work around these and other bottlenecks? 

PV: The most significant bottleneck associated with this process is finding the “sweet spot” number of parallel processes I mentioned above. As I said, we could theoretically break it down into 4 million single-loan processes all running in parallel. But managing this amount of distributed computation, even in the cloud, invariably creates a degree of overhead which ultimately degrades performance. 

And so how do we find that sweet spot – how do we optimize the number of servers on the distributed computation engine? 

As I alluded to earlier, the process involved an element of trial and error. But we also developed some home-grown tools (and leveraged some tools available in AWS) to help us. These tools enable us to visualize computation server performance – how much of a load they can take, how much memory they use, etc. These helped eliminate some of the optimization guesswork.   

Is this optimization primarily hardware based?

PV: AWS provides essentially two “flavors” of machines. One “flavor” enables you to take in a lot of memory. This enables you to keep a whole lot of loans in memory so it will be faster to run. The other flavor of hardware is more processor based (compute intensive). These machines provide a lot of CPU power so that you can run a lot of processes in parallel on a single machine and still get the required performance. 

We have done a lot of R&D on this hardware. We experimented with many different instance types to determine which works best for us and optimizes our output: Lots of memory but smaller CPUs vs. CPU-intensive machines with less (but still a reasonably amount of) memory. 

We ultimately landed on a machine with 96 cores and about 240 GB of memory. This was the balance that enabled us to run portfolios at speeds consistent with our SLAs. For us, this translated to a server farm of 50 machines running 70 processes each, which works out to 3,500 workers helping us to process the entire 4-million-loan portfolio (across 50 Monte Carlo simulation paths and 4 different scenarios) within the established SLA.  

What software-based optimization made this possible? 

PV: Even optimized in the cloud, hardware can get pricey – on the order of $4.50 per hour in this example. And so, we supplemented our hardware optimization with some software-based optimization as well. 

We were able to optimize our software to a point where we could use a machine with just 30 cores (rather than 96) and 64 GB of RAM (rather than 240). Using 80 of these machines running 40 processes each gives us 2,400 workers (rather than 3,500). Software optimization enabled us to run the same number of loans in roughly the same amount of time (slightly faster, actually) but using fewer hardware resources. And our cost to use these machines was just one-third what we were paying for the more resource-intensive hardware. 

All this, and our compute time actually declined by 10 percent.  

The software optimization that made this possible has two parts: 

The first part (as we discussed earlier) is using the MapReduce methodology to break down jobs into optimally sized chunks. 

The second part involved optimizing how we read loan-level information into the analytical engine.  Reading in loan-level data (especially for 4 million loans) is a huge bottleneck. We got around this by implementing a “pre-processing” procedure. For each individual servicer, we created a set of optimized loan files that can be read and rendered “analytics ready” very quickly. This enables the loan-level data to be quickly consumed and immediately used for analytics without having to read all the loan tapes and convert them into a format that analytics engine can understand. Because we have “pre-processed” all this loan information, it is immediately available in a format that the engine can easily digest and run analytics on.  

This software-based optimization is what ultimately enabled us to optimize our hardware usage (and save time and cost in the process).  

Contact us to learn more about how we can help you optimize your mortgage analytics computational processing.


Rethink Analytics Computational Processing – Solving Yesterday’s Problems with Today’s Technology and Access 

We sat down with RiskSpan’s co-founder and chief technology officer, Suhrud Dagli, to learn more about how one mortgage investor successfully overhauled its analytics computational processing. The investor migrated from a daily pricing and risk process that relied on tens of thousands of rep lines to one capable of evaluating each of the portfolio’s more than three-and-a-half million loans individually (and how they actually saved money in the process).  

Here is what we learned. 


Could you start by talking a little about this portfolio — what asset class and what kind of analytics the investor was running? 

SD: Our client was managing a large investment portfolio of mortgage servicing rights (MSR) assets, residential loans and securities.  

The investor runs a battery of sophisticated risk management analytics that rely on stochastic modeling. Option-adjusted spread, duration, convexity, and key rate durations are calculated based on more than 200 interest rate simulations. 

GET A FREE DEMO OR FREE TRIAL

Why was the investor running their analytics computational processing using a rep line approach? 

SD: They used rep lines for one main reason: They needed a way to manage computational loads on the server and improve calculation speeds. Secondarily, organizing the loans in this way simplified their reporting and accounting requirements to a degree (loans financed by the same facility were grouped into the same rep line).  

This approach had some downsides. Pooling loans by finance facility was sometimes causing loans with different balances, LTVs, credit scores, etc., to get grouped into the same rep line. This resulted in prepayment and default assumptions getting applied to every loan in a rep line that differed from the assumptions that likely would have been applied if the loans were being evaluated individually.  

The most obvious solution to this would seem to be one that disassembles the finance facility groups into their individual loans, runs all those analytics at the loan level, and then re-aggregates the results into the original rep lines. Is this sort of analytics computational processing possible without taking all day and blowing up the server? 

SD: That is effectively what we are doing. The process is not a speedy as we’d like it to be (and we are working on that). But we have worked out a solution that does not overly tax computational resources.  

The analytics computational processing we are implementing ignores the rep line concept entirely and just runs the loans. The scalability of our cloud-native infrastructure enables us to take the three-and-a-half million loans and bucket them equally for computation purposes. We run a hundred loans on each processor and get back loan-level cash flows and then generate the output separately, which brings the processing time down considerably. 

SPEAK TO AN EXPERT

So we have a proof of concept that this approach to analytics computational processing works in practice for running pricing and risk on MSR portfolios. Is it applicable to any other asset classes?

SD: The underlying principles that make analytics computational processing possible at the loan level for MSR portfolios apply equally well to whole loan investors and MBS investors. In fact, the investor in this example has a large whole-loan portfolio alongside its MSR portfolio. And it is successfully applying these same tactics on that portfolio.   

An investor in any mortgage asset benefits from the ability to look at and evaluate loan characteristics individually. The results may need to be rolled up and grouped for reporting purposes. But being able to run the cash flows at the loan level ultimately makes the aggregated results vastly more meaningful and reliable. 

A loan-level framework also affords whole-loan and securities investors the ability to be sure they are capturing the most important loan characteristics and are staying on top of how the composition of the portfolio evolves with each day’s payoffs. 

ESG factors are an important consideration for a growing number of investors. Only a loan-level approach makes it possible for these investors to conduct the kind of property- and borrower-level analyses to know whether they are working toward meeting their ESG goals. It also makes it easier to spot areas of geographic concentration risk, which simplifies climate risk management to some degree.  

Say I am a mortgage investor who is interested in moving to loan-level pricing and risk analytics. How do I begin? 

 SD: Three things: 

  1.  It begins with having the data. Most investors have access to loan-level data. But it’s not always clean. This is especially true of origination data. If you’re acquiring a pool – be it a seasoned pool or a pool right after origination – you don’t have the best origination data to drive your model. You also need a data store that can generate loan-loan level output to drive your analytics and models.
  2. The second factor is having models that work at the loan level – models that have been calibrated using loan-level performance and that are capable of generating loan-level output. One of the constraints of several existing modeling frameworks developed by vendors is they were created to run at a rep line level and don’t necessarily work very well for loan-level projections.  
  3. The third thing you need is a compute farm. It is virtually impossible to run loan-level analytics if you’re not on the cloud because you need to distribute the computational load. And your computational distribution requirements will change from portfolio to portfolio based on the type of analytics that you are running, based on the types of scenarios that you are running, and based on the models you are using. 

The cloud is needed not just for CPU power but also for storage. This is because once you go to the loan level, every loan’s data must be made available to every processor that’s performing the calculation. This is where having the kind of shared databases, which are native to a cloud infrastructure, becomes vital. You simply can’t replicate it using a on-premise setup of computers in your office or in your own data center. 

So, 1) get your data squared away, 2) make sure you’re using models that are optimized for loan-level, and 3) max out your analytics computational processing power by migrating to cloud-native infrastructure. Thank you, Suhrud, for taking the time to speak with us.


Live Demo of RiskSpan’s Award-Winning Edge Platform–3

Wednesday, August 24th | 1:00 p.m. EDT

Live Demo of RiskSpan’s award-winning Edge Platform. Learn more and ask questions at our bi-weekly, 45-minute demo.

Historical Performance Tool: Slice and dice historical loan performance in the Agency and PLRMBS universe to find outperforming cohorts.

Predictive Loan-Level Pricing and Risk Analytics: Produce loan-level pricing and risk on loans, MSRs, and structured products in minutes – with behavioral models applied at the loan-level, and other assumptions applied conveniently to inform bids and hedging.

Loan Data Management: Let RiskSpan’s data scientists consolidate and enhance your data across origination and servicing platforms, make it analytics-ready, and maintain if for ongoing trend analysis.


About RiskSpan:

RiskSpan offers cloud-native SaaS analytics for on-demand market risk, credit risk, pricing and trading. With our data science experts and technologists, we are the leader in data as a service and end-to-end solutions for loan-level data management and analytics.

Our mission is to be the most trusted and comprehensive source of data and analytics for loans and structured finance investments.

Rethink loan and structured finance data. Rethink your analytics. Learn more at www.riskspan.com.

Presenters

Joe Makepeace

Director, RiskSpan

Jordan Parker

Sales Executive, RiskSpan


RiskSpan Introduces Multi-Scenario Yield Table 

ARLINGTON, Va., August 4, 2022

RiskSpan, a leading provider of residential mortgage and structured product data and analytics, has announced a new Multi-Scenario Yield Table feature within its award-winning Edge Platform.  

REITs and other mortgage loan and MSR investors leverage the Multi-Scenario Yield Table to instantaneously run and compare multiple scenario analyses on any individual asset in their portfolio. 

An interactive, self-guided demo of this new functionality can be viewed here. 

Comprehensive details of this and other new capabilities are available by requesting a no-obligation live demo at riskspan.com. 

Request a No-Obligation Live Demo

With a single click from the portfolio screen, Edge users can now simultaneously view the impact of as many as 20 different scenarios on outputs including price, yield, WAL, dv01, OAS, discount margin, modified duration, weighted average CRR and CDR, severity and projected losses. The ability to view these and other model outputs across multiple scenarios in a single table eliminates the tedious and time-consuming process of running scenarios individually and having to manually juxtapose the resulting analytics.  

Entering scenarios is easy. Users can make changes to scenarios right on the screen to facilitate quick, ad hoc analyses. Once these scenarios are loaded and assumptions are set, the impacts of each scenario on price and other risk metrics are lined up in a single, easily analyzed data table. 

Analysts who determine that one of the scenarios is producing more reasonable results than the defined base case can overwrite and replace the base case with the preferred scenario in just two clicks.   

The Multi-Scenario Yield Table is the latest in a series of enhancements that is making the Edge Platform increasingly indispensable for mortgage loan and MSR portfolio managers. 


 About RiskSpan, Inc.  

RiskSpan offers cloud-native SaaS analytics for on-demand market risk, credit risk, pricing and trading. With our data science experts and technologists, we are the leader in data as a service and end-to-end solutions for loan-level data management and analytics. 

Our mission is to be the most trusted and comprehensive source of data and analytics for loans and structured finance investments. 

Rethink loan and structured finance data. Rethink your analytics. Learn more at www.riskspan.com.

Media contact: Timothy Willis 


Get Started
Log in

Linkedin   

risktech2024